

2023–2026 Prince William County, VA Multi-Election Actual Vote Analysis One complete unit of Actual Vote analysis work: one election in one state, with all the submissions, transcriptions, comparisons, investigations, and findings that produce one published report.
Thirteen elections, 2020–2026 · Prince William County, Virginia · completed August 2026, after certification of every election covered
av-report-20230101-va-prince-william-multi-v1.0
- Poll tapes transcribed Scanned poll tapes published by Prince William County and transcribed by the Actual Vote system — roughly 1,700 linear feet of tape across thirteen elections.
- 974
- Comparisons
- 13,986
- Votes audited
- 1,668,865
Executive Summary
America Counts audited vote reporting in Prince William County, Virginia across thirteen elections held between November 2020 and August 2026. Unlike our other analyses, no volunteers were in the field: Prince William County publishes scanned images of its poll tapes on its own website, so the source material was already public. We downloaded all 1,033 published files, transcribed the 974 poll tapes among them with the Actual Vote system, and compared the results to the Virginia Department of Elections’ official per-precinct results.
From 974 transcribed poll tapes we produced 13,986 comparisons, covering 1,668,865 votes. As in every Actual Vote analysis, the first automated pass produced a set of initial non-matches — values where the transcribed figure and the official figure did not yet agree. Resolving those is the next stage of the analysis, and every one resolved here: most turned out to be tapes that carry more than one tally, which have to be added together, and several were votes recorded on paper accompanying the tape that the printed tally does not carry at all. No apparent discrepancy arose. Every difference was accounted for, and none was large enough to have affected the outcome of any contest.
This analysis was also an experiment, and we are reporting it as one. We wanted to know how quickly, how accurately, and how cheaply America Counts could audit vote reporting at scale when a county makes its poll tapes available. The answer: 974 tapes for $84.80 in transcription cost and under four hours of machine time. That is the case for poll-tape publication in a single number. Where a county posts its tapes, independent verification of its reported results is no longer expensive or slow — it is close to free.
Because this is a methods report as much as a results report, we describe what we learned in unusual detail. Much of it was new to us: these tapes carry structures the Actual Vote system had not encountered before, and each one is now something it knows how to read. Automated transcription did the overwhelming majority of the work, and a person read the original PDFs at eleven points where the paper required human judgement. Both halves of that sentence matter, and we explain each below.
1. Scope
| Analysis ID | Thirteen per-election analyses, <YYYYMMDD>_usa_va_princewilliam,
reported together. Each is a self-contained analysis; the figures in this report are
their sum. |
|---|---|
| State | Virginia, United States |
| Elections | Thirteen, November 2020 – August 2026: the 2020, 2023, 2024 and 2025 November generals; the 2023, 2024 (March and June), 2025 and 2026 primaries; and four special elections (February 2023, January, March and April 2026). |
| Analysis Window | Entirely retrospective. Every election covered was certified long before this analysis began. Poll tapes were downloaded from the county on August 7, 2026 and the comparison completed August 9, 2026. |
| Counties Represented | Prince William |
| Recording Team | None. Unlike our other analyses, no volunteers recorded these tapes. The county publishes scanned images of them itself, so the source material was already public before we began. |
| Poll Tape Access Method(s) | Downloaded from the county’s own published archive at pwcvotes.org, one page per election. No records request was required. Every file was stored verbatim with its SHA-256 recorded at download time, so the corpus is re-verifiable and any later replacement of a file is detectable. |
| Official Results Source | The Virginia Department of Elections results export for each election, published at enr.elections.virginia.gov. Comparisons use the Election Day figure, which is the group corresponding to what a precinct’s scanner tape reports. |
| Voting Methods Covered | Election Day only. Early, mailed-absentee and provisional ballots are outside the scope of a precinct poll tape and are not audited here. |
| Analysis Status | Complete for the ten elections with a resolvable official export. Three — the 2020 general and the February and June 2023 elections — have no export we could resolve, so no comparison was possible; their tapes were transcribed and checked against their own internal arithmetic, and they contribute no comparisons to the totals below. |
2. What Is an Actual Vote Analysis?
An Actual Vote analysis is an independent batch-comparison audit of the vote-reporting chain. It asks one narrow, checkable question: do the vote totals a precinct’s own scanner printed on election night match the totals the state later published for that precinct?
It is not a risk-limiting audit. There is no statistical risk limit, and no ballots are examined. Our claims extend exactly as far as our coverage and no further. An Actual Vote analysis cannot tell you whether ballots were counted correctly, whether voters were eligible, or whether an election’s outcome was right. It tells you whether the numbers the machines printed survived the journey into the published record intact.
That is a narrow question, and it is worth asking precisely because it is narrow. The poll tape and the official results are independently produced records — the tape is printed by the scanner in the polling place, in public, before the results travel anywhere. Systematic agreement between the two is very hard to produce by accident, and errors in our own process surface as mismatches to investigate, not as false confirmations.
3. Methodology Notes for This Analysis
How vote reporting works in Virginia
The Virginia Department of Elections publishes an election results export at the grain of precinct × contest × choice × voting method. The voting methods are Election Day, Early Voting, Mailed Absentee, Provisional and Post-Election. Election Day is the group that corresponds to what a precinct’s scanner tape reports, so the join between tape and official results is exact and requires no allocation or apportionment. Every comparison in this report is against the Election Day figure.
Three of the thirteen elections have no resolvable official export, so no comparison was possible for them; they are reported separately below and contribute no comparisons to the headline figures.
Data collection
Prince William County publishes results tapes on its own website, one page per election. The pages are client-side tables that serve only their first page of results to a plain request — the November 2024 page shows 15 rows and actually contains 107 — so the harvester drives the rendered page, walking the pagination until it stops changing.
Every file was downloaded verbatim, its payload checked to be a complete PDF, and its SHA-256 recorded, so the corpus is re-verifiable and we can detect if a file is later replaced. 1,033 of 1,033 files downloaded with zero failures: 974 poll tapes and 59 county-generated reports. The tapes were never edited; all derived images are generated from the originals.
Transcription and comparison
Poll tapes are long and narrow — a single tape can be ten times taller than it is wide — so each scan is rendered at high resolution and sliced into overlapping horizontal bands, each of which is transcribed independently. Where bands disagree about a number, the disagreement is resolved using the tape’s own arithmetic (see below), never by reference to the official figure.
Transcribed values were then compared to the official export at matching grain by a scripted comparison. At no point does the comparison use an official vote value to decide what a tape says. That distinction is the reason the method is admissible at all, and we return to it below.
Definitions
A poll tape is the printed results receipt produced by a precinct’s ballot scanner. A comparison is one transcribed value checked against one officially reported value at the same grain. An apparent discrepancy is a comparison that mismatched and has no plausible benign explanation — the headline integrity number, and the only discrepancy statistic we report in a stat box.
4. Results in Brief
| Election | Tapes | Comparisons | Votes audited | Reconciled |
|---|---|---|---|---|
| 2023 General (Nov 7) | 104 | 4,516 | 770,331 | 100% |
| 2024 Presidential Primary (Mar 5) | 103 | 1,133 | 36,413 | 100% |
| 2024 June Primary (Jun 18) | 104 | 2,307 | 30,975 | 100% |
| 2024 General (Nov 5) | 103 | 1,992 | 367,273 | 100% |
| 2025 June Primary (Jun 17) | 103 | 1,098 | 28,841 | 100% |
| 2025 General (Nov 4) | 103 | 1,660 | 343,512 | 100% |
| 2026 Special (Jan 13) | 13 | 52 | 1,058 | 100% |
| 2026 Special (Mar 10) | 12 | 48 | 1,505 | 100% |
| 2026 Special (Apr 21) | 103 | 309 | 77,018 | 100% |
| 2026 August Primary (Aug 4) | 103 | 871 | 11,939 | 100% |
| Total (comparable) | 851 | 13,986 | 1,668,865 | 100% |
| 2020 General (Nov 3) | 4 | — | — | no official export |
| 2023 February Special (Feb 21) | 15 | — | — | no official export |
| 2023 June Primary (Jun 20) | 104 | — | — | no official export |
Of the 13,986 comparisons, 13,985 matched exactly. The one remaining is a write-in resolution: on one tape the scanner’s catch-all write-in count was 8 where the county later reported 6, with every named candidate matching exactly — two write-in votes that were not credited to any named write-in candidate at canvass. Under our published methodology that is a match, not a discrepancy, and we report it as such rather than folding it silently into the exact-match count.
Sample comparisons
Nothing here has to be taken on trust. Both sides of every comparison in this analysis are public: the tape scans Prince William County publishes itself on one side, the Virginia Department of Elections results exports on the other. Anyone can open both and check this work themselves.
But doing that is laborious and dull, and it takes a bit of practice to know where to look. So we do some of it for you here. These sample comparisons show concretely what happens under the hood in an Actual Vote analysis — how one line of printed paper becomes one value, and how that value is matched to the figure Virginia certified — and they let someone who is never going to re-run the whole analysis still check a piece of it with their own eyes, as evidence that our conclusions hold.
The 10 are chosen mechanically, by a fixed stride or a seeded draw through the sorted results rather than by hand, so the selection cannot be arranged to flatter the outcome — and they are a representative mix of how values are read: most by AI transcription, and, where this analysis needed it, values a person read from the source because the machine declined to guess or the paper carried something the printed tally did not. Here is one of them, carrying the number it has on that page:
The one below is the hardest kind this corpus contains, and it is here for that reason. Precinct 402 ran two scanners and also hand-counted seven ballots the scanners could not read, on a signed paper form bound into the same PDF. The printed tallies alone come to 824; Virginia published 830. Nothing is wrong — the county’s full paper record says 830, and a comparison that read only the printed tape would have reported a difference that does not exist.
What the poll tape printed


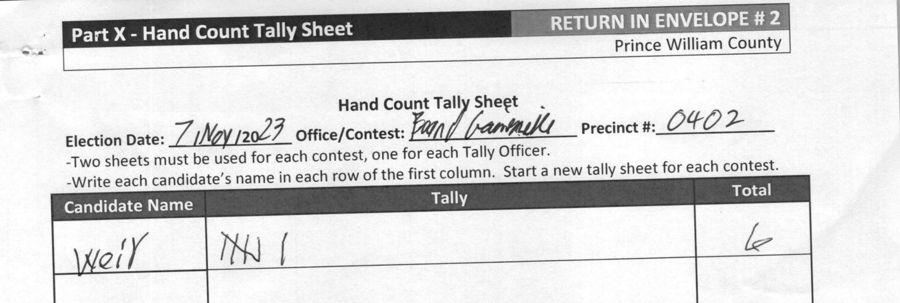
Robert B. "Bob" Weir — 830 (the two printed tallies read by AI OCR; the hand-count sheet read by a person from the county's scan)
Two scanners and a hand count: 440 + 384 + 6 = 830.
Official certified result
Robert B. "Bob" Weir — 830
Source & location
export-2023-Nov-Gen.json
localResults[name="PRINCE WILLIAM COUNTY"] → ballotItems[name="Member, Board of Supervisors (Gainesville District)"] → ballotOptions[name="Robert B. "Bob" Weir"] → precinctResults[name~"402"] → groupResults[groupName="Election Day"].voteCount = 830 Every figure on that page can be checked against the county’s published scan and the state’s published results file, without taking anything here on trust.
5. Discussion of Results
A check we have never been able to run before
Because this analysis holds every poll tape in the county — not a sample, not the precincts a recording team could reach, but all of them — a further check becomes available that no previous Actual Vote analysis could perform. Sum every tape and compare the totals, per contest and per choice, against what the county published.
| Elections reconciling exactly at county level | 9 of 10 |
|---|---|
| Summed poll tape total | 1,683,098 |
| County’s published Election Day total | 1,683,096 |
| Difference | 2 |
| Share of the county’s Election Day votes covered | 100.00% |
The difference of two is the write-in resolution described above — the one contest where the tape’s catch-all count was 8 and the canvass credited 6. Summing 974 tapes independently reproduces the county’s published Election Day total to within that single, already-explained item.
What this shows, and what it does not. It shows completeness: no precinct is missing from the published aggregate, none duplicated, none mis-totalled. That is something the per-precinct comparison structurally cannot see, since it only covers precincts we hold tapes for — a precinct absent from our corpus altogether would leave every individual comparison matching and nothing amiss.
It does not verify any individual precinct, because offsetting errors cancel: five votes wrong one way in one precinct and five the other way in another sum to zero. Comparing per choice narrows that — cancelling errors would have to fall on the same candidate in the same contest — but does not close it. So this reconciliation contributes nothing to the votes-audited figure, which counts only values compared at the grain where tape and official record independently correspond. We report it as its own result, and would report it the same way if it were the only check available.
What poll tapes can and cannot cover
Election Day votes are 52.6% of all votes cast in the county across these elections. The remainder — early, mailed-absentee and provisional — never appears on a precinct poll tape, so no amount of tape coverage reaches it. That is the ceiling of this method as applied to precinct tapes, and it belongs alongside the 1.67 million figure rather than in a footnote.
What sparse publication costs: the 2020 comparison
The county’s 2020 posting is the counter-example, and it is the clearest evidence we have for how tapes should be published rather than merely whether.
For 2020 the county posted four PDFs — each a consolidated tape covering three to ten precincts at once — amounting to roughly two per cent of the county’s vote that year. From that material: no per-precinct comparison is possible, because a tape covering ten precincts cannot be joined to ten per-precinct official rows. No county-level reconciliation is possible either, because two per cent of the tapes cannot reconcile to a county total. Even the tape’s own internal arithmetic returns inconclusive on every contest, because a consolidated tape pools ballots from precincts that did not all carry the same contests.
We transcribed them anyway and report what they contain, but the honest yield is zero verified votes.
The same county, four years later, publishes one tape per precinct for every precinct and every election — and that supports 13,986 comparisons and a complete county reconciliation. The difference in transparency value is close to total, and it is not a difference in effort. It is a difference in whether tapes are posted per precinct or pre-aggregated.
What “100%” means here, precisely
It means that for every precinct, contest and choice that Virginia published an Election Day figure for in these ten elections, the poll tape package reports the same number.
The phrase tape package is doing real work. For six values, the printed tally alone does not equal the official figure — and it should not, because the county also files a signed hand-count tally sheet recording ballots the scanners could not read, and those votes are in the official total. On one 2023 tape, a candidate’s two scanners printed 440 and 384 while the county reported 830; the hand-count sheet, bound into the same PDF, supplies the missing 6. A pipeline that read only the printed tally would have called that a discrepancy and been wrong. That is the comparison shown in full under Sample comparisons above — both printed tallies and the signed sheet, with the addition written out, so the claim can be read off the paper rather than taken from this paragraph.
So the finding is not merely that the tapes match. It is that the county’s full paper record — printed tally, hand-count sheets, and the annotations officers wrote on them — reconciles exactly with what the county published. That is a stronger statement about the integrity of the reporting chain than a printed-tape-only match would have been.
How an Actual Vote analysis actually proceeds
An analysis runs in stages, and each stage hands its unfinished business to the next.
Stage one is automated transcription. Every tape is read by machine, and the transcribed values are compared to the official results. That pass produces matches and it produces initial non-matches — values that do not yet agree. Initial non-matches are the expected output of a first pass, not a defect in it. Getting none would be remarkable; expecting none would be naive.
Stage two is human judgement, applied to what the first pass could not settle. Here
that meant eleven values, read by a person from the same public PDFs anyone can download.
Six of them are votes that exist only on paper the printed tally does not carry — four
signed hand-count tally sheets and two handwritten corrections an officer wrote directly on
a tape (+1 and +2 beside a printed total). No system reading the printed tape could
have found those, because they are not on it; finding them meant knowing to read the rest
of the envelope. The remaining five sit on the tape but in a form that needs a human eye:
a figure with an officer’s pen mark running through it, and write-in lines that cannot be
attributed to a contest for a structural reason described below.
Stage three, where needed, is asking the election office. It was not needed here — nothing survived stage two unresolved. In previous analyses it has been, and county officials have so far been able to account for everything we brought them.
That progression is the method, not a rescue of it. The machine reads at a scale and cost no human effort could match; a person is brought in exactly where the paper demands judgement; the officials who made the record are asked when it demands local knowledge. The eleven values are individually documented with their basis and who determined them, so anyone can check them against the same source we used.
What these tapes turned out to contain
Most initial non-matches here traced back to a single discovery, and it is the most useful thing this analysis taught us.
A poll tape is not one set of numbers. A precinct’s published PDF can contain several separate tallies, and the precinct’s real total is their sum:
- a second scanner, announced by a fresh tape header;
- a hand-counted block, printed with no serial number and no ballot counter at all;
- one tally per ballot style on a split precinct — a precinct straddling two
congressional districts prints the same statewide contest twice, once per style, labelled
208 - Colgan CD07and208 - Colgan CD10.
Each of these presents, on a first pass, as a shortfall against the official figure. On the split-precinct tapes, one contest’s totals of 171 and 2 belong to the same precinct and are added to reach the published 173. None of this is documented anywhere we could have looked up in advance; it is legible only by reading the tapes closely, and the Actual Vote system now knows to look for all three.
A tape’s own arithmetic is the check with teeth. Every contest on a Verity tape must
satisfy candidates + write-ins + undervotes + overvotes = ballots cast. That test uses no
official data whatsoever, which makes it genuinely independent of the thing it is checking —
and it catches things the comparison alone cannot. On one tape a line was transcribed twice,
the second reading garbled, producing two candidate rows of 38 votes each. The comparison
scored that contest a match, because it sets aside an unmatched near-duplicate before
scoring. The tape’s own arithmetic did not: 294 votes against 256 ballots, and
294 − 38 = 256 exactly. This is why we run an internal consistency check on every tape
rather than relying on agreement with official results alone.
We also learned to state that check directionally. More votes than ballots is impossible. Equal is a pass. Fewer is inconclusive — because the contest may simply not appear on every ballot, as in a party primary or a split precinct. Tested as a strict equality it “failed” 95 of 104 contests in one primary, all meaninglessly.
A transcription system’s most useful signal is when it declines
The most interesting behaviour we observed was not misreading. On a handful of image bands the transcription declined to read at all — returning the candidate names and marking every value unreadable, on lines a person finds perfectly legible. Asking again reproduced the refusal exactly, byte for byte, which tells you something useful: a refusal is not random noise to be retried, but a deterministic property of the image as framed. Re-slicing the tape at a different band size recovered every value.
Two practical lessons for anyone attempting this work. A system that declines when unsure is far more valuable than one that guesses — a refusal is visible and can be routed to a person, while a confident wrong answer is not. And re-slicing re-reads the whole tape, so it should be checked across the whole tape rather than only the line being chased.
The write-in line is anonymous, and that is its own problem
Every candidate row carries a name, which means a clipped or misread contest header can be
recovered from the candidate: a name appearing in exactly one contest identifies that
contest by itself. The write-in line reads only Write-ins. It identifies nothing, so
when a band loses the header the line cannot be placed. After every other class of
difference was closed, write-ins were the last ones standing.
Where it is the only unknown in a contest, the tape determines it by subtraction. Where it is not — one tape lost its write-in, overvote and undervote rows together, three unknowns against one equation — the honest answer is to report it and let a person read the paper, which is what we did.
Our transcription against the county’s own
The 2026 scans carry a text layer applied by the county’s own scanning software. That makes them an independent second transcription of the same pixels, and the only place in this corpus where our reading can be measured against another machine’s rather than against the results it is checking.
On the 218 tapes that carry a layer, covering 899 official choices:
| Values recovered | Exact against official | |
|---|---|---|
| Actual Vote | 899 (100%) | 899 (100%) |
| County’s own text layer | 849 (94.4%) | 835 (92.9%) |
The county’s layer misses 50 values outright and disagrees with the official figure on 14
more. It also garbles the header badly — Prince William County comes through as
RrtficbsWilliam County, and Election Day Voting as ictibn Day Voting — while
transcribing the vote figures beneath it accurately.
This comparison should be read with care. The tapes that carry a text layer are the simplest in the corpus, carrying one to three contests; the complex multi-contest tapes are from years with no layer at all. We can say our transcription outperformed the county’s scanner on the tapes where both exist. We cannot say how the county’s software would fare on the hard ones, and we are not going to imply it.
What this analysis does and does not establish
It establishes that the reporting of 1,668,865 Election Day votes in Prince William County, across thirteen elections, is faithful to what the precinct scanners printed — and that the county’s supporting paper reconciles with its published results.
It does not establish that those votes were counted correctly, that ballots were valid, or that any outcome was right. Coverage is Election Day only; early, absentee and provisional ballots are outside the scope of a precinct tape and are not audited here. Three elections have no official export and could not be compared at all. And every election covered was certified long before we began, so this is a retrospective verification, not an election-night check.
Chain of custody and timing
We did not handle any ballots, tapes or equipment. The source material is the county’s own published scans, downloaded from its website with each file’s SHA-256 recorded at download time. Anyone can repeat this analysis from the same public files, and the sample comparisons page links directly to the county’s copy of every tape it cites.
That is a weaker chain of custody than a contemporaneous recording made by a trained observer, and a stronger one in a different respect: the evidence is public, permanent and identical for every reader.
Cost and speed
| Poll tapes transcribed | 974 |
| Image bands transcribed | 6,456 |
| Transcription cost | $84.80 |
| Cost per tape | 8.7¢ |
| Machine time | 3.9 hours |
The cost figure is the actual amount spent on automated transcription, including the exploratory runs and the targeted re-reads described above. It does not include analyst time, which was substantial and is where the real expense of this work lies. Appendix A sets out what the system does well and where it needs a person.
We publish it because the number is the argument. Auditing thirteen elections’ worth of poll tapes cost less than a hundred dollars. When a county publishes its tapes, independent verification of its reported results stops being a question of resources.
6. Thanks
Our thanks to Prince William County, Virginia, whose Office of Elections publishes scanned poll tapes for every election on its public website. Nothing in this report required a records request, a lawsuit or a phone call. The county simply posted the evidence, and that decision is what made this analysis possible.
We hope this report is read as what it is: a demonstration of what a county earns by publishing its tapes. Prince William made its own reporting checkable by anyone, and it checks out.
7. Technical and Legal Notes
Non-partisan statement. America Counts is a project of Democracy Counts, Inc., a 501(c)(3) non-profit. We take no position on candidates, parties or outcomes, and this report should not be read as supporting or opposing any of them.
Data sources. Poll tape images published by the Prince William County Office of Elections at pwcvotes.org. Official results from the Virginia Department of Elections results export. File-level provenance, including SHA-256 for every downloaded file, is retained with the analysis.
Conclusions and opinions in this report are solely the work of America Counts. They are not the conclusions of Prince William County, the Virginia Department of Elections, or any election official, none of whom were contacted in the course of this analysis — because nothing in it required explanation from them.
Accuracy of contextual information. Descriptions of Virginia election administration are our own educated understanding. Readers should verify specifics with the relevant election authorities.
Using this report. Every election covered here was certified before this analysis began. Nothing in this report can or should be used to challenge a certified result.
Note for election administrators. Auditing high-stakes systems is valuable regardless of how those systems perform, and a clean result is a useful result. We found nothing wrong with Prince William County’s vote reporting across thirteen elections, and we think that is worth publishing precisely because it is unremarkable.
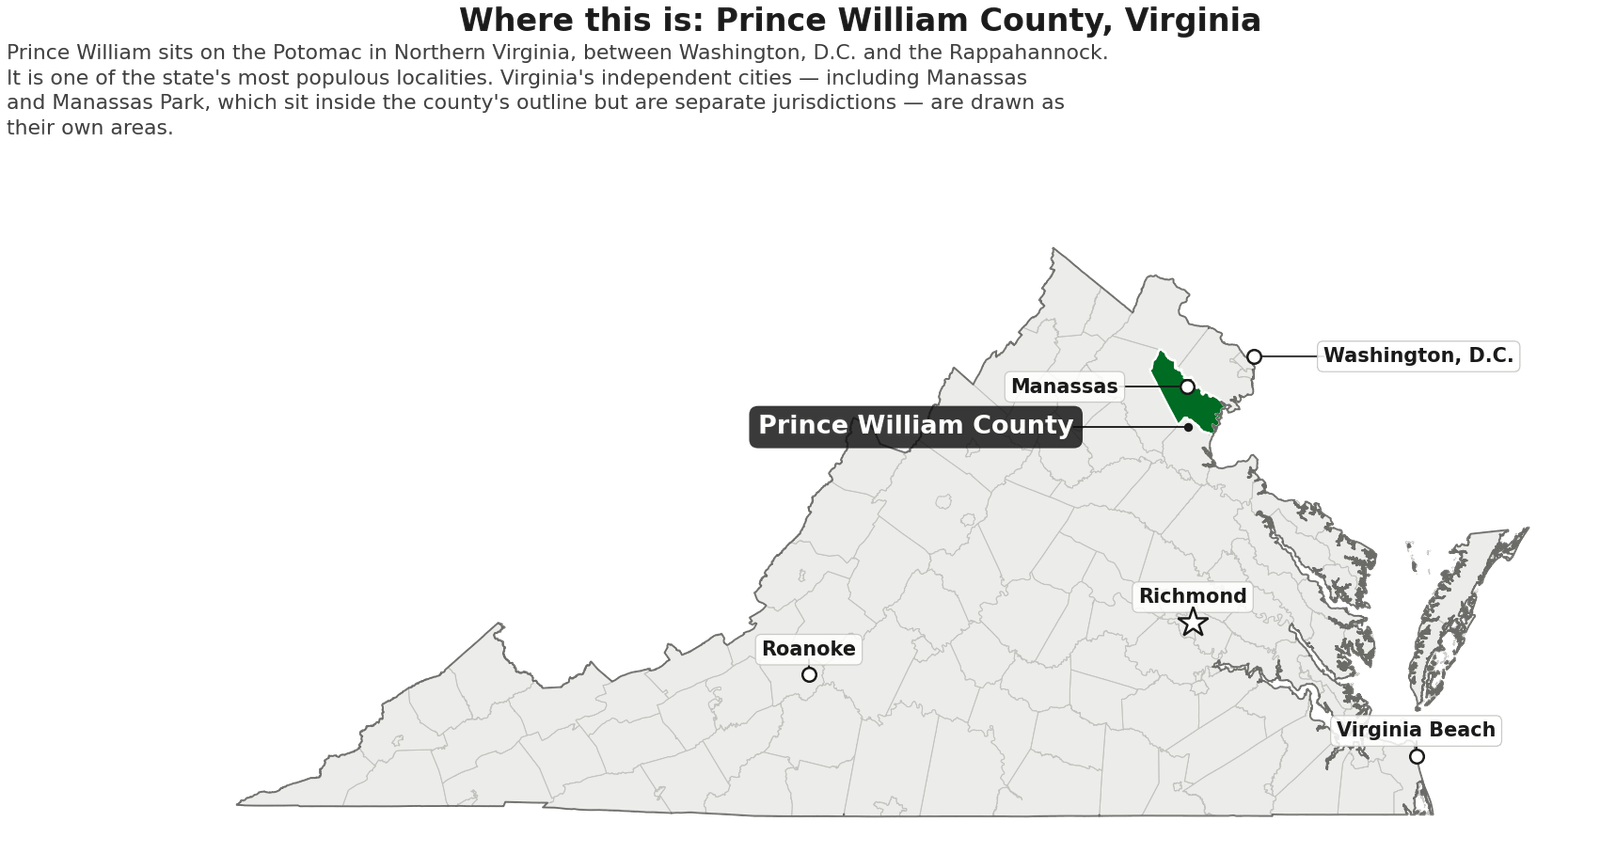
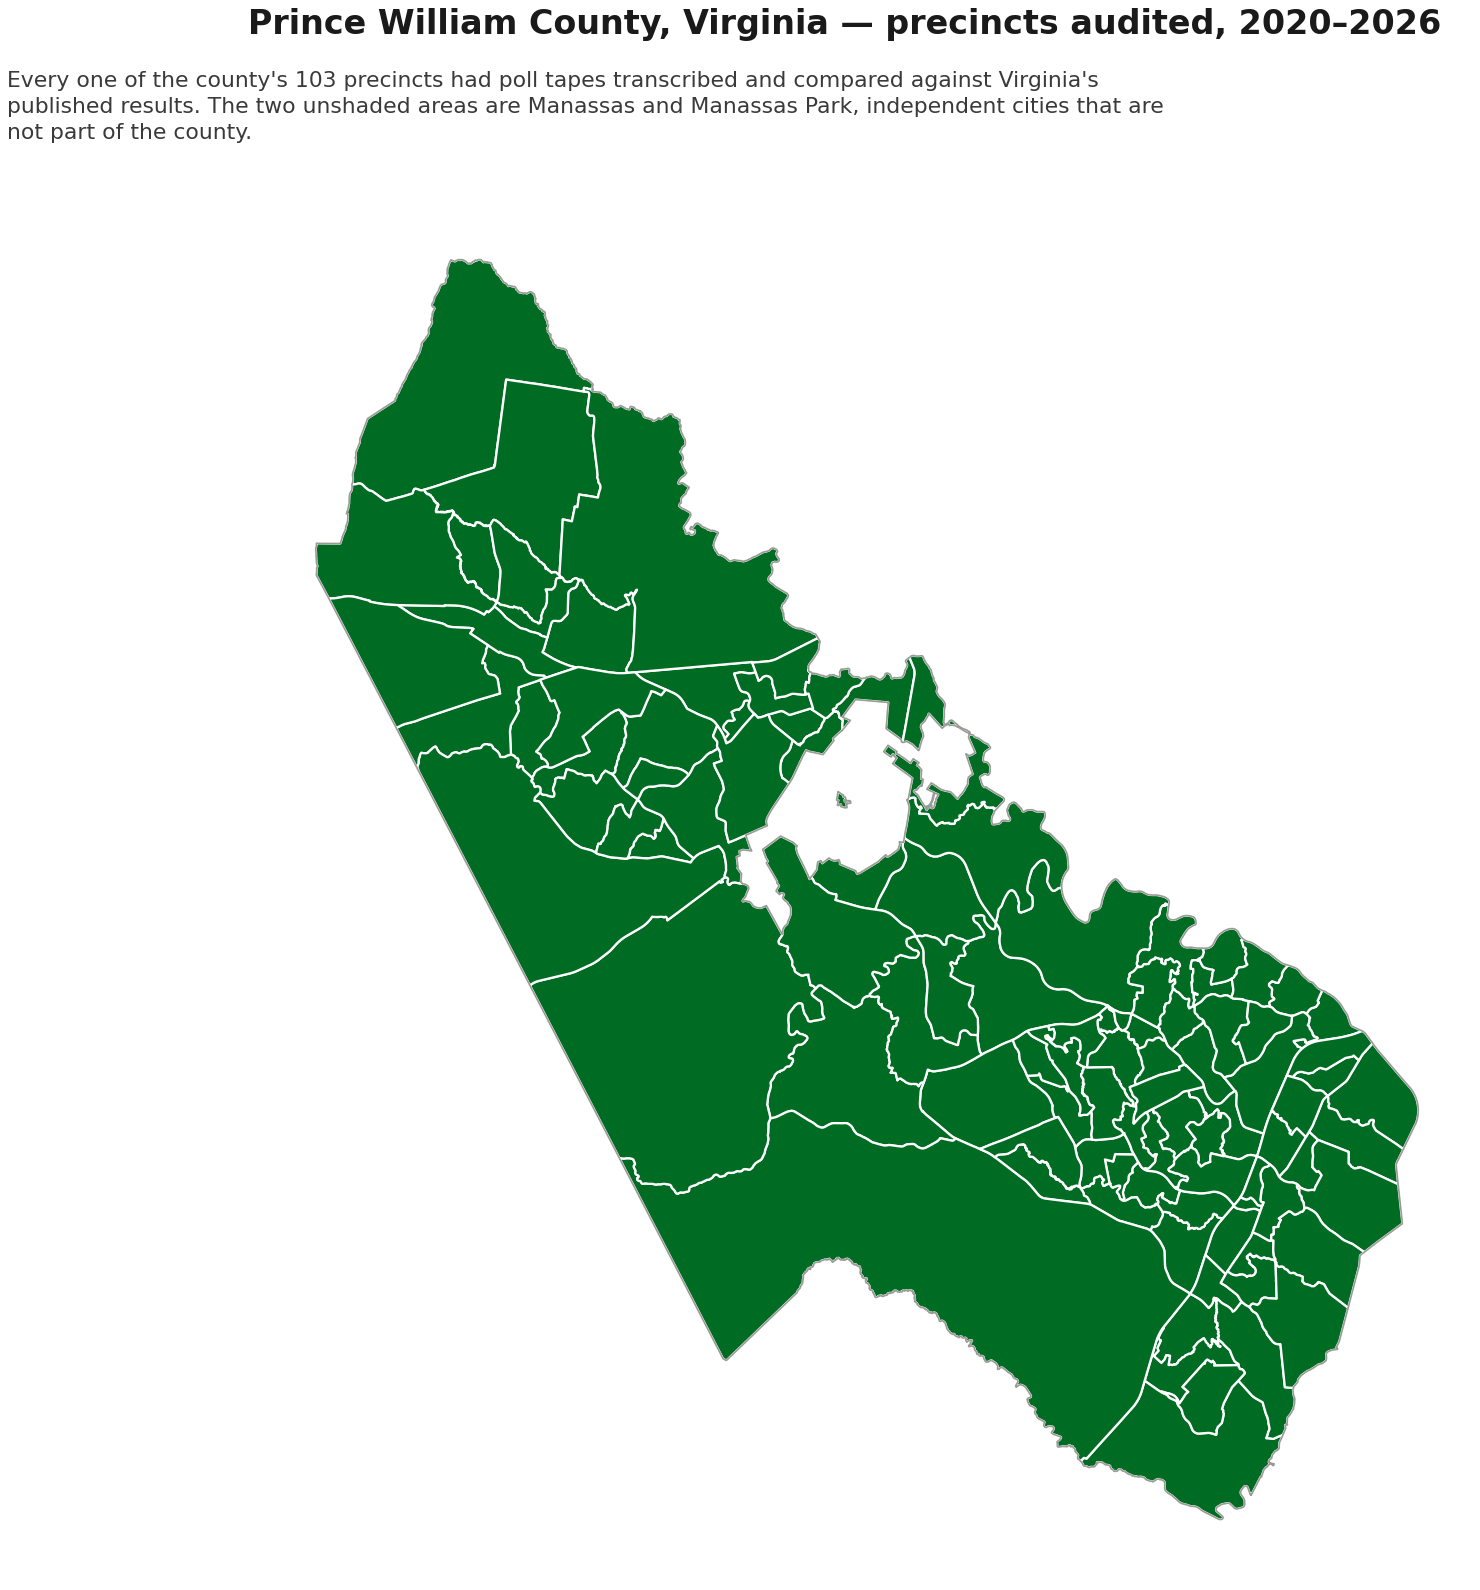
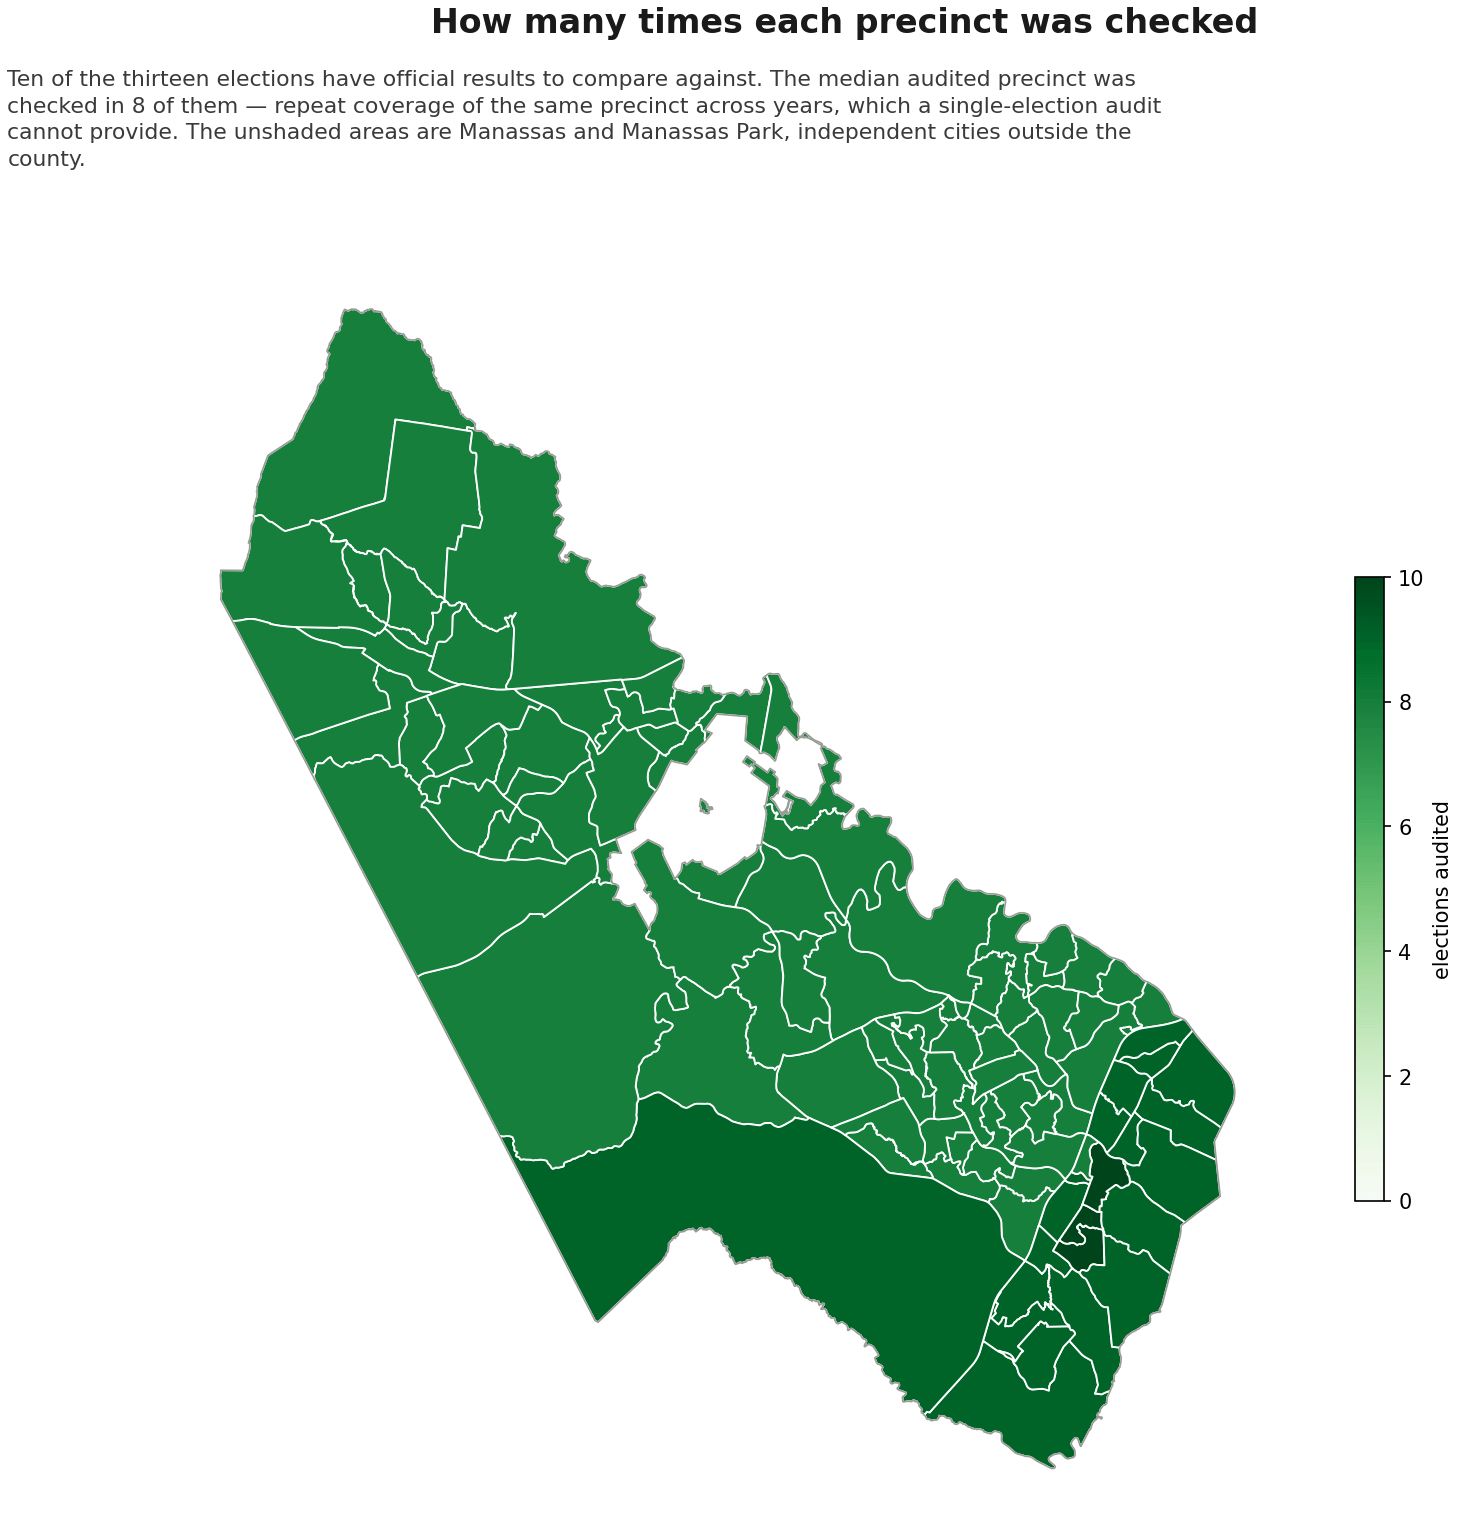
Images. Header photograph of the Henry Hill house and monument at Manassas National Battlefield Park by Brian Lefevre on Unsplash. Coverage maps produced by America Counts from the Prince William County voting-precinct boundary layer published on data.virginia.gov.
Licensing. This report is published under CC BY-NC-SA 4.0.
8. Version History
| Version | Date | Change |
|---|---|---|
| 1.0 | 2026-08-09 | Initial publication. 974 tapes; 13,986 comparisons; 1,668,865 votes audited; 0 apparent discrepancies. |
| 1.1 | 2026-09-14 | One of the 974 tapes — the 2020 general’s Central Absentee Precinct tape — turned out never to have been transcribed: its file and the CAP provisional tape beside it resolved to the same internal id during preparation, so one overwrote the other. The tape has now been transcribed (194 values, no count failures), and the corpus reconciles at 974 tapes read. Transcription totals updated accordingly: 6,456 image bands and $84.80 (was 6,385 and $83.87). No comparison, vote total or finding changes — the 2020 election is one of the three with no official export to compare against. |
9. Appendix A — What this tells us about the system’s capabilities and limits
This analysis put the Actual Vote system through more varied material than any before it — 974 tapes, thirteen elections, six years of format changes, four voting-system report layouts. That makes it the best evidence we have about what the system can and cannot do, which matters to anyone deciding whether to rely on it: election officials, audit committee members, volunteers, and the people who fund this work. We would rather set out the limits ourselves than have them discovered later.
What automated transcription does well
Reading printed figures off a scanned thermal tape is the part it does at a level no volunteer effort could match. Across the 218 tapes where the county’s own scanning software also produced a text layer — the only place we can compare our transcription against another machine’s rather than against the answer — the Actual Vote system recovered every one of the 899 official choices and matched official on all of them, where the county’s layer recovered 849 and matched on 835.
It is also fast and cheap enough to change what is feasible: 974 tapes for $84.80 and under four hours. Scale is not the constraint on this work.
Where it needs a person, and why that is by design
Three situations reliably require human judgement, and the system is built to surface them rather than guess:
- Information that is not on the printed tape. Hand-count tally sheets and handwritten corrections carry real votes that appear in the official totals. No amount of transcription quality reaches them; a person has to read the rest of the envelope. Six of this analysis’s eleven human-read values are of this kind.
- Ambiguous paper. An officer’s pen mark running through a printed figure, or two candidates whose surnames differ by one letter in a hand-written block. Where the paper genuinely does not determine the answer, the correct behaviour is to decline and escalate.
- Anonymous rows. A candidate line carries a name that identifies its contest even when
the header is damaged. A write-in line reads only
Write-insand identifies nothing, so a damaged header can leave it unplaceable.
A transcription system that declines when unsure is worth more than one that always answers. Refusals are visible and can be routed to a person; confident wrong answers cannot. We would rather report a value as unread than publish a guess.
The checks that make the result trustworthy
Three independent things have to agree before a value is published:
- The tape’s own arithmetic — candidates plus write-ins plus under- and overvotes must equal the ballots the scanner counted. This uses no official data at all, so it is a genuine check on our reading rather than a restatement of it.
- The comparison to official results, at matching grain.
- Human review of everything the first two leave unsettled.
No single one of these is sufficient. The internal arithmetic caught a duplicated line that the comparison scored as a match; the comparison catches attribution problems the arithmetic cannot see; and human review resolves what neither can.
What we still cannot do
- Handwriting. Hand-count tally sheets are transcribed by a person today. We have not attempted automated reading of tally marks and handwritten names, and would not trust it without substantial validation.
- Compare against results that do not exist. Three of the thirteen elections here have no resolvable official export, so no comparison was possible for them at all.
- Audit anything but the reporting layer. Nothing in this method examines ballots, eligibility, or counting.
10. Appendix B — Why This Analysis Matters
In 2017, Virginia’s House of Delegates race in the 94th district ended in an exact tie — 11,608 votes each after a recount — and control of the entire chamber came down to a name drawn from a bowl. It is the most literal illustration available of how little separation an American election can come down to.
Margins that thin are not a Virginia peculiarity; they are a normal feature of American elections. They mean that the accuracy of vote reporting — the unglamorous business of getting a number from a scanner in a school gym into a state database without alteration — is not a technicality. In a race decided by a handful of votes, a reporting error affecting a single precinct could change who holds office.
Almost nobody checks that link. Recounts re-examine ballots. Risk-limiting audits sample ballots. Both are valuable, and neither asks whether the totals the machines printed on election night are the totals that were published.
That check is cheap. This report demonstrates how cheap: $84.80 for thirteen elections. The only precondition is that a county publish its poll tapes. Prince William County does, and as a result 1,668,865 of its votes have now been independently verified at the reporting layer by people who had to ask no one’s permission.
We would like to be able to write this report about every county in the country. Whether we can is entirely up to the counties.