

2024 Georgia General Actual Vote Analysis One complete unit of Actual Vote analysis work: one election in one state, with all the submissions, transcriptions, comparisons, investigations, and findings that produce one published report.
November 5, 2024 election · Fulton, DeKalb, Gwinnett counties · completed November 18, 2024 (before state certification)
av-report-20241105-ga-general-v1.0
- Comparisons
- 326
- Votes audited
- 76,530
Executive Summary
America Counts used Actual Vote — its system for independently double-checking that vote totals are reported accurately — to check three of Georgia’s largest counties, Fulton, DeKalb, and Gwinnett, for the November 5, 2024 General Election. Volunteers video-recorded the poll tapes posted at their polling places on and after election night, and we compared them to the results the Georgia Secretary of State published. Of the 326 values we could compare — covering 76,530 votes — 325 matched exactly and the one first-pass mismatch resolved to a match with a documented write-in explanation, leaving zero apparent discrepancies.
The finding that matters most here is about the check that couldn’t be made: seventy percent of the values transcribed from these tapes — 778 of 1,105 — had no officially published precinct-level counterpart, and a further 103 early-voting tapes cannot be corroborated by Georgia’s published results at all. Where Georgia published at the grain the tapes record, its 2024 vote reporting in these counties checked out essentially perfectly; the open question is how much of what people can record simply is not published. Georgia elections are decided on thin margins — the 2020 presidential race there came down to 11,779 votes — which is exactly why that transparency gap is worth closing.
New to Actual Vote? Start here.
1. Scope
| Analysis ID | 20241105_usa_ga |
|---|---|
| State | Georgia, United States |
| Election | November 5, 2024 General Election |
| Analysis Window | Before the state certification date of November 19, 2024 (comparison completed November 18, 2024) |
| Counties Represented | Fulton, DeKalb, Gwinnett |
| Poll Tape Access Method(s) | Volunteers across Fulton, DeKalb, and Gwinnett counties video-recorded tapes at their polling places on and after election night using the Actual Vote app or device cameras. |
| Official Results Source | Georgia Secretary of State results data exports (dated captures, Nov 9 – Nov 18, 2024; the analysis used the November 18, 2024 capture) |
| Analysis Status | Closed (comparison completed November 18, 2024; first published 2026) |
| Recording Team | Volunteers across Fulton, DeKalb, and Gwinnett counties |
2. Results in Brief
| Metric | Value |
|---|---|
| Submissions Received | 208 |
| Transcribable Submissions (election day) | 66 |
| Early-Voting Submissions (not comparable from the published results†) | 103 |
| Comparison-Eligible Transcribed Values | 1,105 |
| Possible Comparisons | 326 |
| Transcribed Values For Which No Comparison Is Possible* | 779 (70.5% — 778 with no officially published counterpart, 1 multi-tabulator zero row) |
| Exact Matches | 325 |
| Explained Matches (plausibly equivalent write-in situation) | 1 |
| Apparent Discrepancies | 0 |
| Votes Audited | 76,530 |
| Average Votes per Transcribed Value | 69.3 |
| Average Votes per Transcribable Submission | 1,159.5 |
| Votes Audited as Share of the Covered Counties | 1.17% |
| Votes Audited as Share of Statewide Reported Votes | 0.23% |
* Nearly all of these transcribed values correspond to precinct-level election-day results the Georgia Secretary of State’s office does not publish (see Section 6).
† Georgia’s published results redistribute early votes to each voter’s home precinct, so no published figure corresponds to an early-voting tape. Our later 2026 Cobb County analysis established the remedy — an open-records request for the county’s cast-vote records grouped by tabulator — documented in Vote Reporting in Georgia; these 103 recordings remain candidates for that same treatment.
Sample comparisons
Nothing here has to be taken on trust. Both sides of every comparison in this analysis are public: the public Actual Vote video archive on one side, the Secretary of State's published results on the other. Anyone can open both and check this work themselves.
But doing that is laborious and dull, and it takes a bit of practice to know where to look. So we do some of it for you here. These sample comparisons show concretely what happens under the hood in an Actual Vote analysis — how one line of printed paper becomes one value, and how that value is matched to the figure Georgia certified — and they let someone who is never going to re-run the whole analysis still check a piece of it with their own eyes, as evidence that our conclusions hold.
This report predates that practice, and its sample has not been built yet. It is one of our earlier analyses: the values were transcribed by people from the recordings rather than by the transcription system, and the individual frames each reading came from were not kept, so they have to be recovered from the archive before a sample can be published here. We will put the real comparisons up when that is done. In the meantime, the sample comparisons from our 2026 Cobb County, Georgia analysis show exactly the same method at work — the format and the reasoning are identical; only the election differs.
And the invitation above stands without us. Every recording behind this report is in the public Actual Vote video archive, every official figure is in the Secretary of State's published results, and anyone who wants to work through a comparison — or a hundred — can do it today without waiting for us.
3. Summary of Findings
America Counts audited vote reporting in three of Georgia’s largest counties — Fulton, DeKalb, and Gwinnett — for the November 5, 2024 General Election. Volunteers video-recorded poll tapes at their polling places on and after election night; the comparison was completed on November 18, 2024, before the state certification date of November 19.
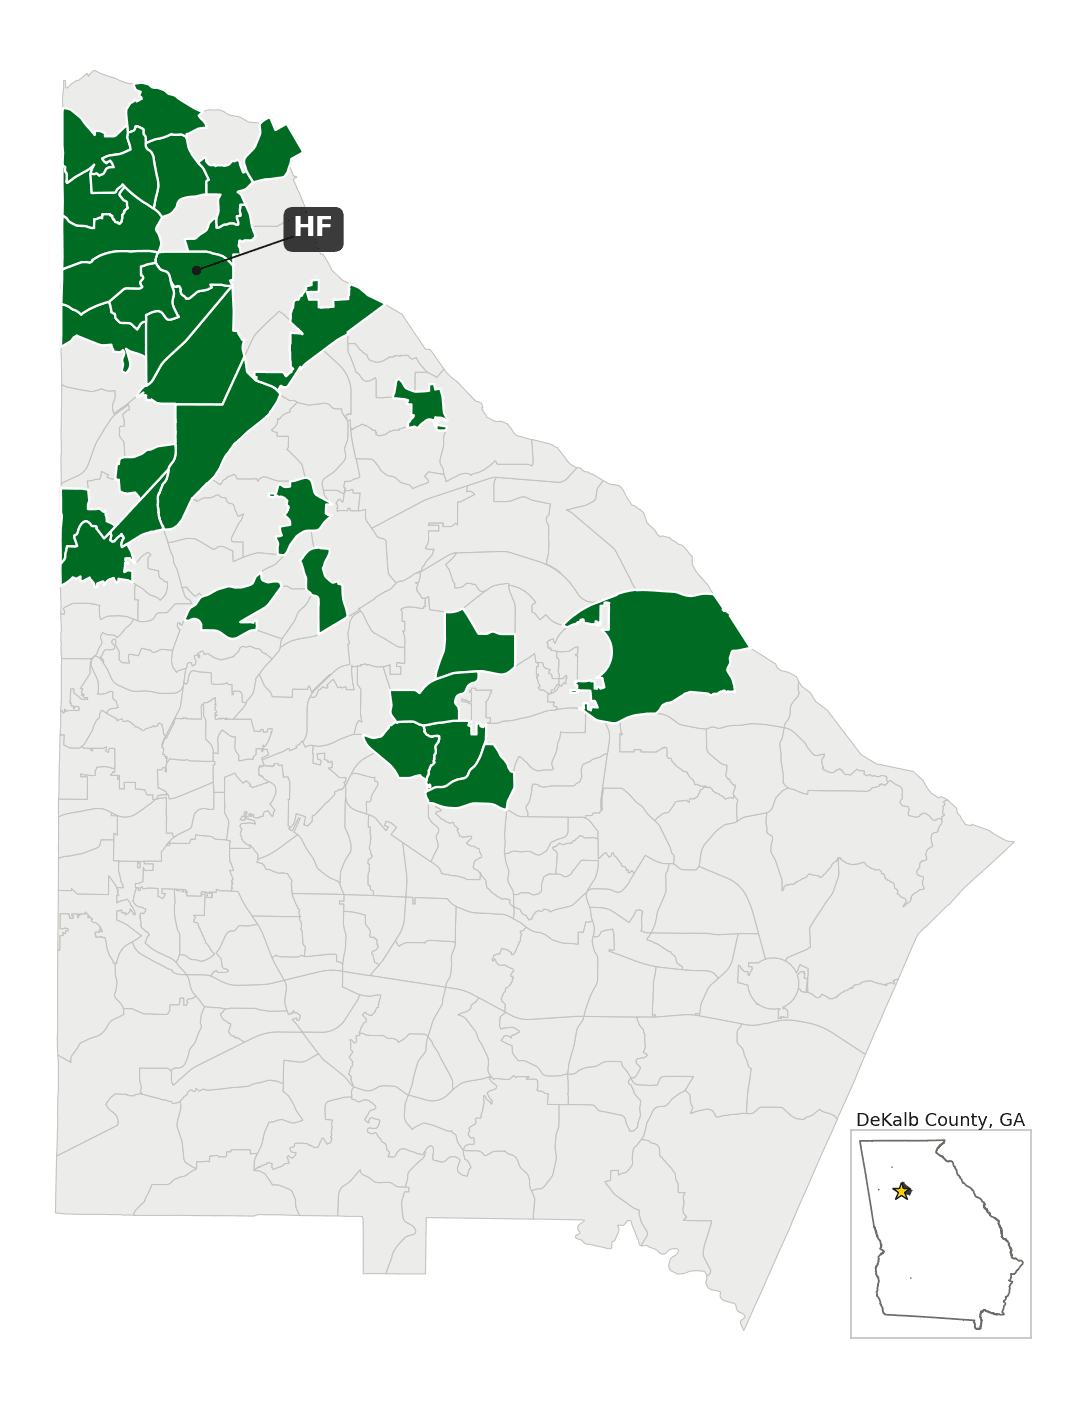
From 66 transcribable election-day submissions we compared 326 values covering 76,530 votes against officially published results. 325 matched exactly. The single first-pass mismatch — one vote for Kamala Harris in DeKalb precinct HF — resolved as a plausibly equivalent write-in situation: the tape printed raw counts for six write-ins and for two court-disqualified candidates whose votes Georgia does not certify; during canvass one write-in was credited to Harris. The arithmetic reconciles exactly, the tape’s own checksum passes, and the dated official exports corroborate it directly — the election-night data matched the tape to the vote; the one-vote change appeared only in the post-canvass data. Zero apparent discrepancies remain.
The analysis’s most consequential finding is about the comparison that could not be made: of 1,105 comparison-eligible values transcribed from the tapes, 778 — seventy percent — had no officially published precinct-level value to compare against. Across all three counties, large numbers of precinct × contest results are published as blank at the election-day level. Poll tape auditing works only where official results are published at the grain the tapes record; in these Georgia counties, for this election, most of that grain was not published. A further 103 early-voting submissions could not be compared against the published results, because Georgia reports early votes by the voter’s home precinct while tapes record vote-center totals (Section 5) — a gap our later 2026 Cobb County analysis showed can be closed with a records request for per-tabulator cast-vote records.
What this analysis demonstrates, then, is double-edged: where Georgia published comparable values, vote reporting checked out essentially perfectly — and a substantial share of what citizens can record from poll tapes cannot currently be checked against what Georgia publishes.
4. What Is an Actual Vote Analysis?
An Actual Vote analysis is an independent comparison of vote totals transcribed from poll tapes to the corresponding officially reported results, serving as a double-check of the accuracy of vote reporting.
Vote reporting is the process by which local-level vote totals from tabulating machines are aggregated to produce the official countywide and statewide results. This process is distinct from vote counting (which covers everything from voter registration through ballot tabulation). An Actual Vote analysis audits only the reporting step — not the casting, counting, or tabulation of ballots.
The methodology is an independent batch-comparison audit of the vote-reporting chain — the same tape-totals-versus-published-results check that risk-limiting audits perform on randomly sampled batches, conducted here at full coverage of the audited precincts. Batch comparison is a peer-reviewed technique that has been in use for over a decade: Colorado has run statewide risk-limiting audits built on it since 2017 (C.R.S. § 1-7-515), and the Election Assistance Commission, Verified Voting, and the Brennan Center for Justice all endorse rigorous post-election auditing. Actual Vote is not a risk-limiting audit — it does not compute or claim a statistical risk limit, and its claims extend exactly as far as its coverage.
For more information, see How Actual Vote Works and Why Actual Vote Is Trustworthy on our website. For the full technical methodology, see Section 8 of the Technical Manual.
5. Methodology Notes for This Analysis
How vote reporting works in Georgia
Georgia’s official results are published by the Secretary of State as structured data exports, one row per County × Precinct × Voting Method × Contest × Choice. Three Georgia-specific structures shaped this analysis (for the poll-tape posting law itself, see Actual Vote in Georgia):
Early voting is not comparable from the published results. Advance (early) voting happens at vote centers serving any voter in the county, but official results redistribute those votes back to each voter’s home precinct. Poll tapes record vote-center totals; official results record home-precinct totals; no published figure corresponds to what an early-voting tape shows. The 103 advance-voting submissions our volunteers recorded are therefore outside this analysis’s comparison scope — it compares election-day tapes only. Since this report was written, our 2026 Cobb County analysis established that this gap can be closed: a narrowly drawn open-records request for the county’s cast-vote records grouped by tabulator reconstructs exactly the per-scanner unit an early-voting tape records, restoring a one-to-one comparison. The method is documented in Vote Reporting in Georgia in our Technical Manual; these 103 recordings remain archived and are candidates for the same treatment.
Precinct-level values are frequently not published. Georgia’s exports include rows for every precinct × contest combination, but for many of them — 70% of the values our volunteers transcribed — the election-day value is blank in the published data. Some precincts share tapes and report jointly (e.g. SS08-SS09 combinations, which the comparison logic rolls up); others simply carry no published election-day value. Section 6 quantifies this.
The tape records lines Georgia does not certify. Tapes print raw machine counts for the catch-all Write-In line and for candidates removed from the ballot by court ruling after machines were configured (Claudia De la Cruz and Cornel West in this election). Official results publish none of these lines; their votes are resolved or discarded during canvass. This is the raw-versus-resolved representation difference behind the write-in equivalence check.
Data collection
Volunteers video-recorded poll tapes at polling places in Fulton, DeKalb, and Gwinnett counties using the Actual Vote app or device cameras, on and shortly after election night. In total we received 208 submissions: 66 were transcribable election-day results tapes, 103 were advance-voting tapes (out of comparison scope as described above), and the remainder were zero tapes, duplicates, or other non-transcribable content.
All poll tape recordings used in this analysis are publicly available at av.democracycounts.org (see Section 10).
Transcription and comparison
Poll tape vote totals were transcribed by hand from the video recordings into structured spreadsheets — a main pass covering the presidential and congressional races with per-contest totals and signature counts, and fuller per-county passes covering down-ballot contests. The comparison was conducted in Python: for each combination of county, precinct, voting method, contest, and choice, the transcribed value was compared directly to the officially published total, with any mismatch flagged as an initial non-match for investigation.
Official results were captured as five dated exports of the Georgia Secretary of State’s results data between November 9 and November 18, 2024. The final comparison ran against the November 18 data; the earlier snapshots proved decisive in resolving the one mismatch this analysis produced.
Definitions
A submission is the set of all videos and/or images submitted through the Actual Vote app or sent directly to America Counts that contribute to depicting one specific thing (most often a single results tape).
A transcribable submission is a submission that depicts a results tape with clearly readable header information and at least one legible contest/choice/vote total for comparison to official results.
A comparison is a transcribed value that can be matched one-to-one against an officially published value at the same grain. Values whose official counterpart is not published, and tape lines Georgia does not certify, are not comparisons and are reported separately throughout.
For the full set of formal definitions used across all Actual Vote analyses, see the Technical Manual glossary.
6. Discussion of Results
One mismatch, fully resolved: the DeKalb HF write-in
Of 326 comparisons, 325 matched exactly. The single first-pass mismatch: in DeKalb precinct HF, the tape shows Kamala Harris with 359 election-day votes; the official results show 360.
The tape itself contains the explanation. It also printed 6 raw write-in votes, 3 votes for Claudia De la Cruz, and 2 for Cornel West — eleven votes on lines Georgia does not certify (De la Cruz and West were removed from Georgia’s ballot by court ruling after the machines were configured; their votes are void). The tape’s own printed total, 579, checksums exactly against its line values. The official results publish 569 votes across the four qualified candidates — the tape’s 579 minus ten uncertifiable votes — with Harris one vote higher than the tape: precisely what one write-in vote for Harris, resolved to her total during canvass, produces. The five-condition write-in equivalence check passes in full.
The dated official exports then corroborate it independently: in the November 9 export, marked “Election Night Complete,” Harris’s HF election-day total is 359 — identical to the tape. The 360 appears only in the post-canvass data. The machine’s election-night count and the tape agree exactly; the one-vote difference is a canvass resolution event, not a reporting error. Per the discrepancy taxonomy, this comparison is classified as a match, and this analysis reports zero apparent discrepancies.
One methodological note, honestly stated: applying the equivalence check here required extending its “raw write-in pool” to include the disqualified candidates’ lines, since Georgia publishes no write-in lines of any kind at the precinct level. The extension is documented in the check artifact and the Technical Manual; the arithmetic is exact and the snapshot evidence is independent of it.
The finding that matters most: most tape values had nothing to compare against
Our volunteers transcribed 1,105 comparison-eligible values from the 66 election-day tapes. For 778 of them — 70.4% — the officially published data contains no election-day value for that precinct and contest: the row exists in Georgia’s export, but its value is blank. This affected all three counties (Gwinnett 321 values, Fulton 230, DeKalb 226) and entire precincts at a time.
This is not a discrepancy — there is no conflicting number — but it is the analysis’s central transparency finding. The audit’s power was capped not by what volunteers could record (they recorded plenty) but by what the state publishes at the precinct level. A vote reporting audit can only verify the grain the jurisdiction publishes; for these counties in this election, 70% of the recordable evidence had no published counterpart. We encourage Georgia election authorities to publish complete precinct-level results by voting method — the data plainly exists, since portions of it are published — and would welcome dialogue about the reporting pipeline behind these gaps.
What the comparison does and does not establish
Where comparison was possible, this analysis provides evidence that vote reporting was accurate: 76,530 votes verified with zero unexplained differences, in the most scrutinized counties of one of the most scrutinized states in the country, completed before state certification. The audit-power analysis in Section 9 makes the limits explicit: at this coverage no contest was fully verified, and unaudited votes exceed every margin. The value of the result is the independent spot-verification itself — and the documented finding about what could not be verified.
Limitations of this analysis
This analysis covers election-day voting only, in the precincts where we obtained transcribable recordings, compared against the officially published precinct values where those exist. Early voting (the majority of Georgia turnout), absentee, and provisional votes are not covered — early voting because the published results cannot corroborate an early-voting tape (Section 5; a per-tabulator cast-vote-record request, as in our later Cobb County analysis, would be required). Down-ballot coverage varies by county. The 70% of transcribed values without published counterparts are disclosed but unverified in either direction. The analysis was completed before state certification but after county certifications.
7. Thanks and Acknowledgments
America Counts thanks the volunteers across Fulton, DeKalb, and Gwinnett counties who video-recorded poll tapes for this analysis — many of them working on election night, at scale, in Georgia’s largest counties. Their recordings are the evidentiary foundation of everything in this report.
We also acknowledge the Georgia Secretary of State’s practice of publishing structured, dated results exports, which made both the comparison and the snapshot-based resolution of the single mismatch possible — and we repeat our encouragement, in the spirit of the transparency that motivated those exports, to publish complete precinct-level values by voting method.
8. Technical and Legal Notes
Non-partisan statement
This report is the work of America Counts, a non-partisan 501(c)(3) nonprofit organization. Working to improve election transparency and accuracy — including by issuing reports like this one — is inherently non-partisan. This report has no stated or implied partisan intent of any kind. For more on how and why America Counts maintains its non-partisan commitment, see Non-Partisan Election Advocacy on our website.
America Counts is a project of Democracy Counts, Inc. Our website is americacounts.us and our contact email is info@democracycounts.org.
Data sources
This report is based entirely on data that is either freely available to the public or available for free upon request. Poll tape data was obtained via video recordings taken with the Actual Vote app or with users’ device cameras. Official results were captured as dated exports from the Georgia Secretary of State’s public results data. All poll tape recordings used in this analysis are publicly available at av.democracycounts.org.
Conclusions and opinions
All analysis and conclusions in this report are the sole work and viewpoint of America Counts. They are not necessarily the opinion of any other person or organization, including the Georgia Secretary of State or any county election authority.
Accuracy of contextual information
Some information in this report about how vote reporting works in Georgia reflects educated guesses and inferences by America Counts based on publicly available resources, poll tape data, and our existing knowledge of election systems. Not all such information has been directly confirmed by the relevant election authorities. If you wish to use this information, proceed with appropriate caution and verify directly with the relevant election authorities where possible.
Using this report
This analysis was completed on November 18, 2024, before the state certification date of November 19, 2024. While the data and analysis contained herein may be suitable for other purposes, no such suitability is expressed or implied by America Counts.
Note for election administrators
America Counts engages in vote report auditing in the spirit of teamwork, advocacy for election transparency, and civic engagement. We are deeply grateful to the many honest and professional election administrators across the United States. By undertaking this analysis, we are not representing any presumption that their work is inherently suspect or that error or fraud must have occurred. Independent audits of high-stakes systems are critical regardless of how well the people in those systems are performing.
Images
The header photo is the north Georgia mountains by Josh Moore on Unsplash, used under the Unsplash License. All other images in this report are public domain, licensed by America Counts, or produced by America Counts.
Licensing
This report is released under a Creative Commons Attribution-NonCommercial-ShareAlike 4.0 International license (CC BY-NC-SA 4.0). You may remix, adapt, and build upon this work non-commercially, provided you acknowledge America Counts and do not imply endorsement.
9. Detailed Results
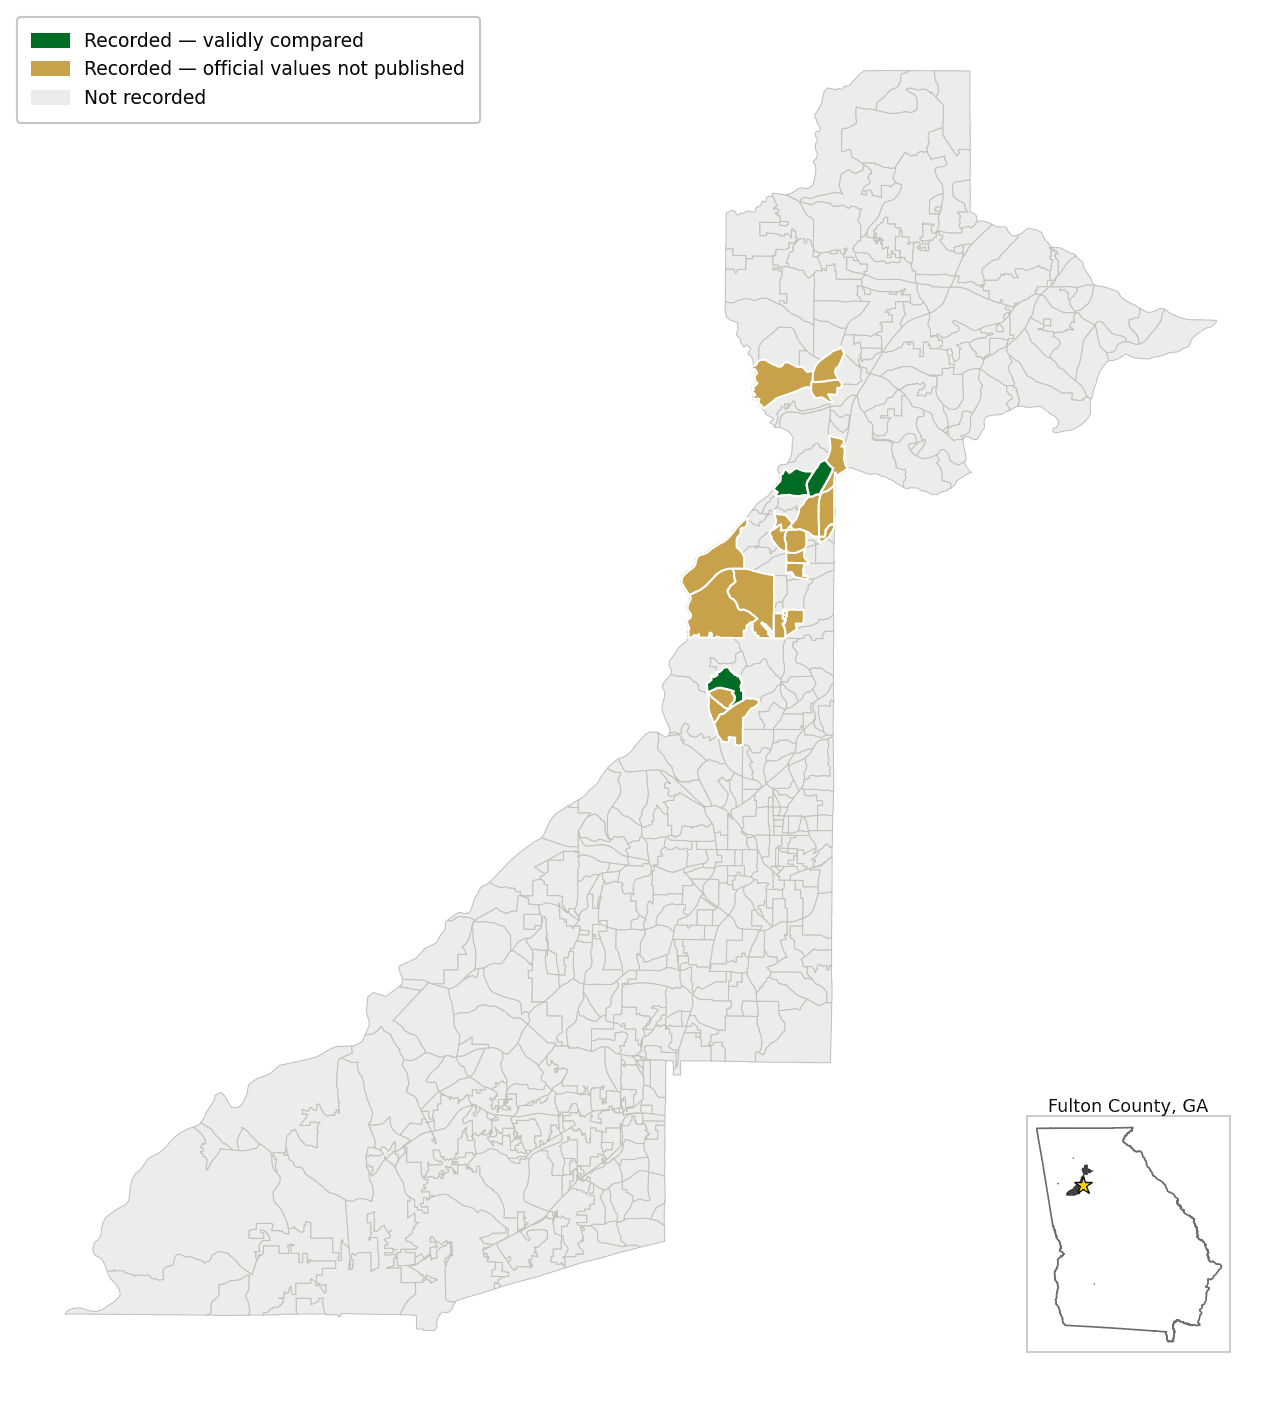
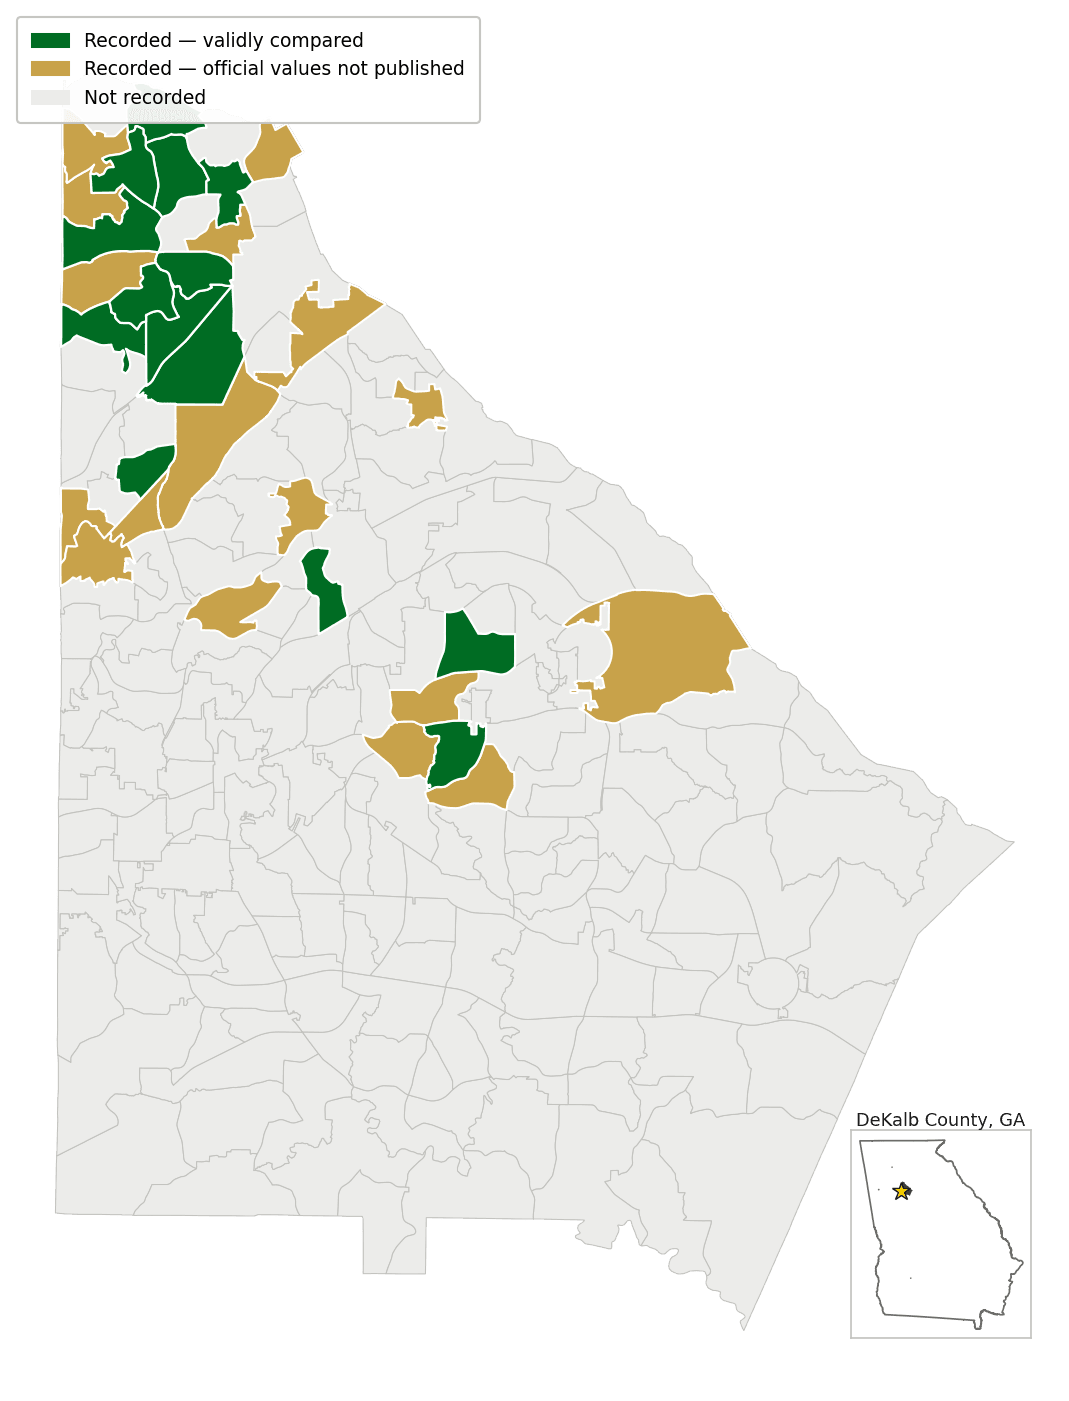
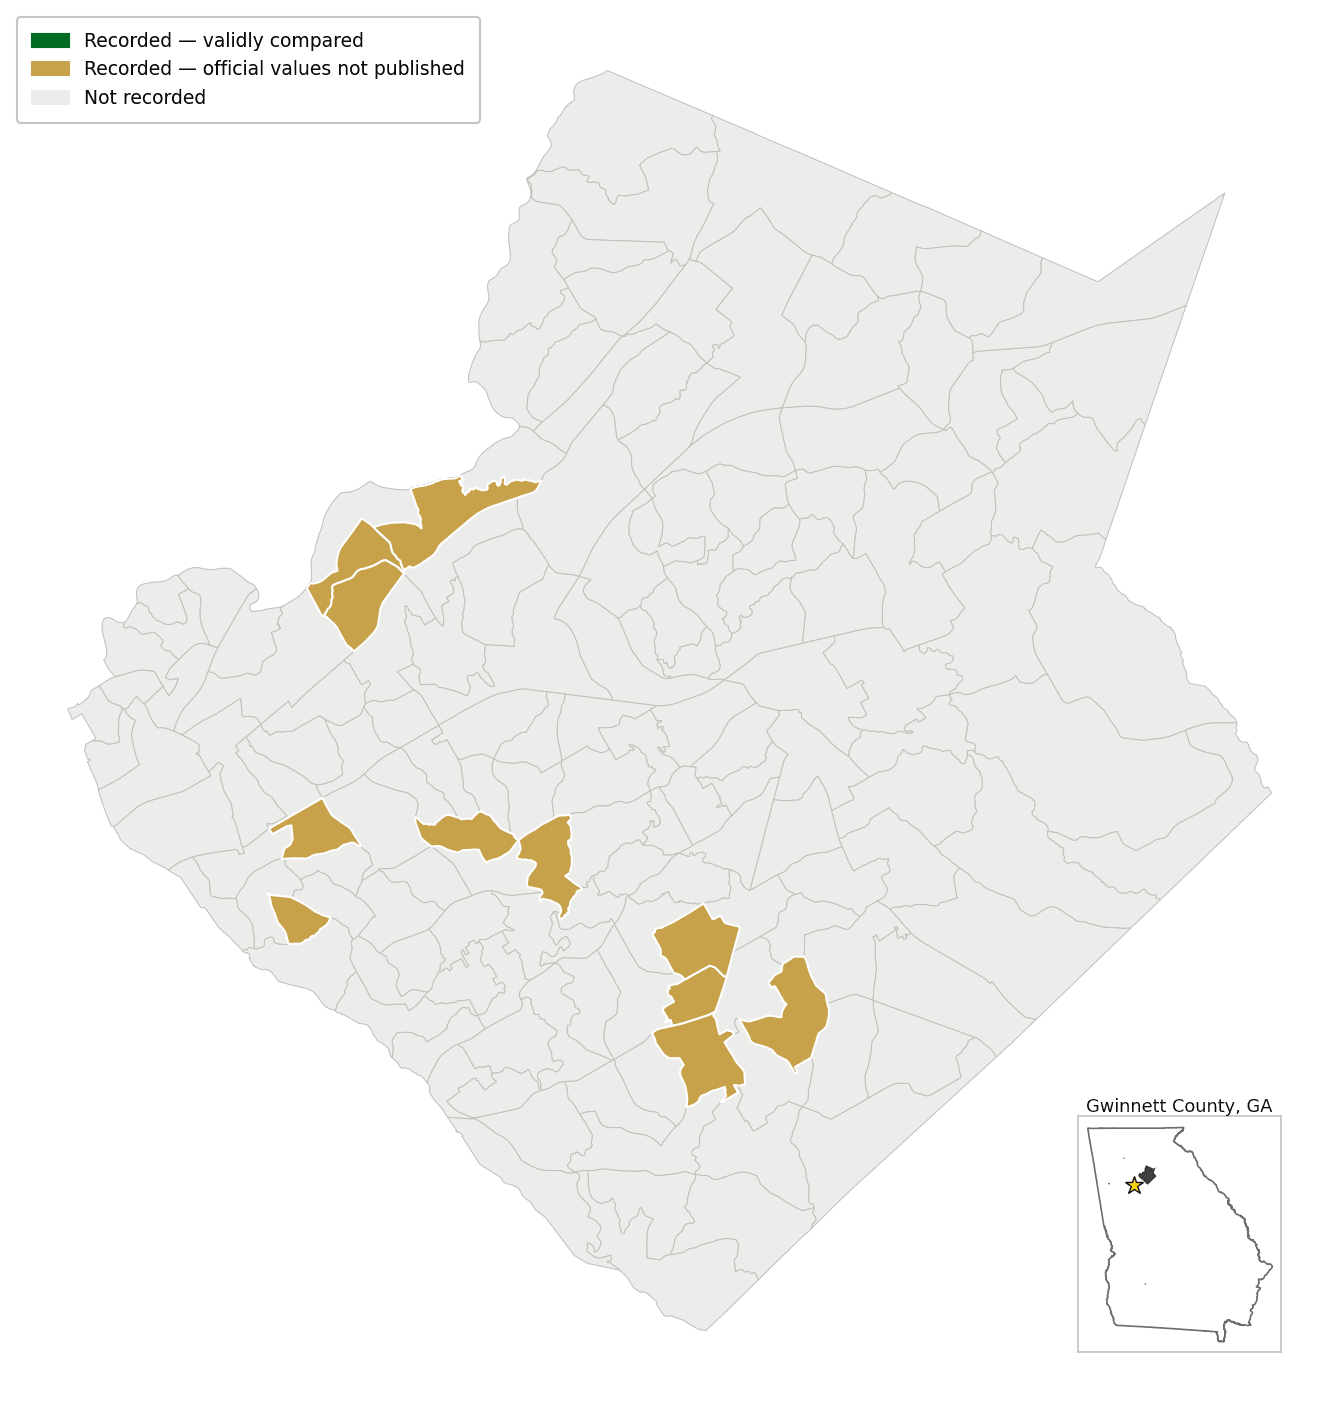
Maps
Comparison status by precinct
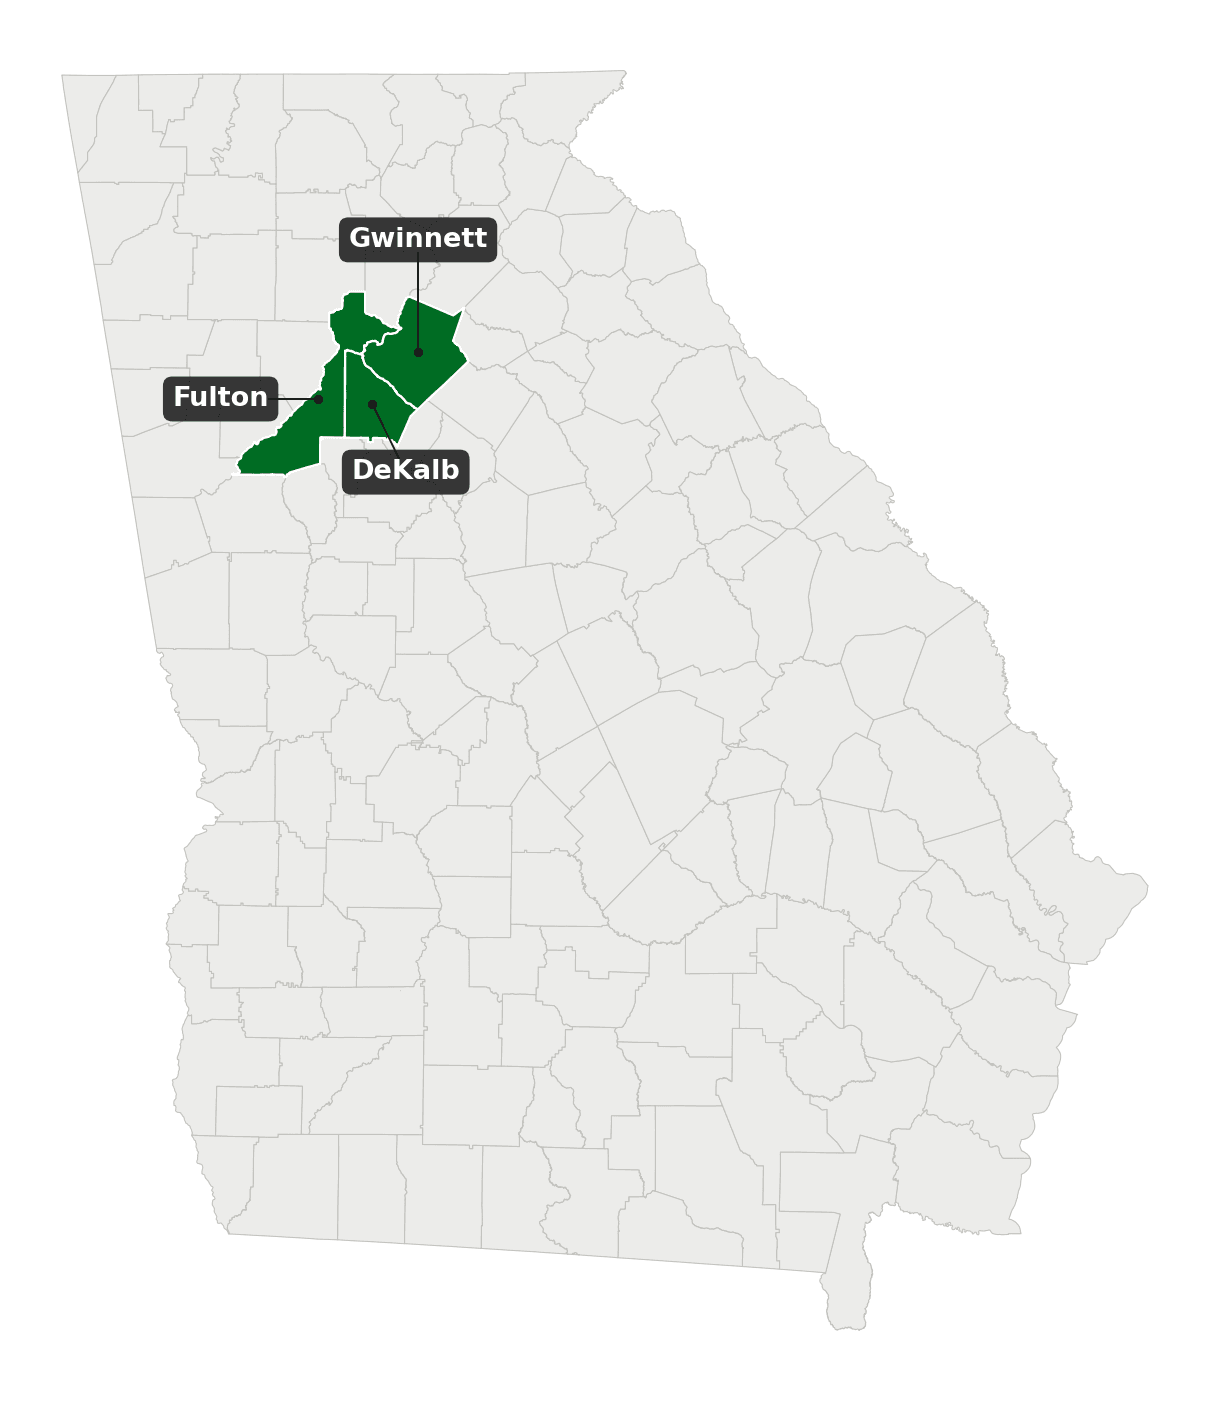
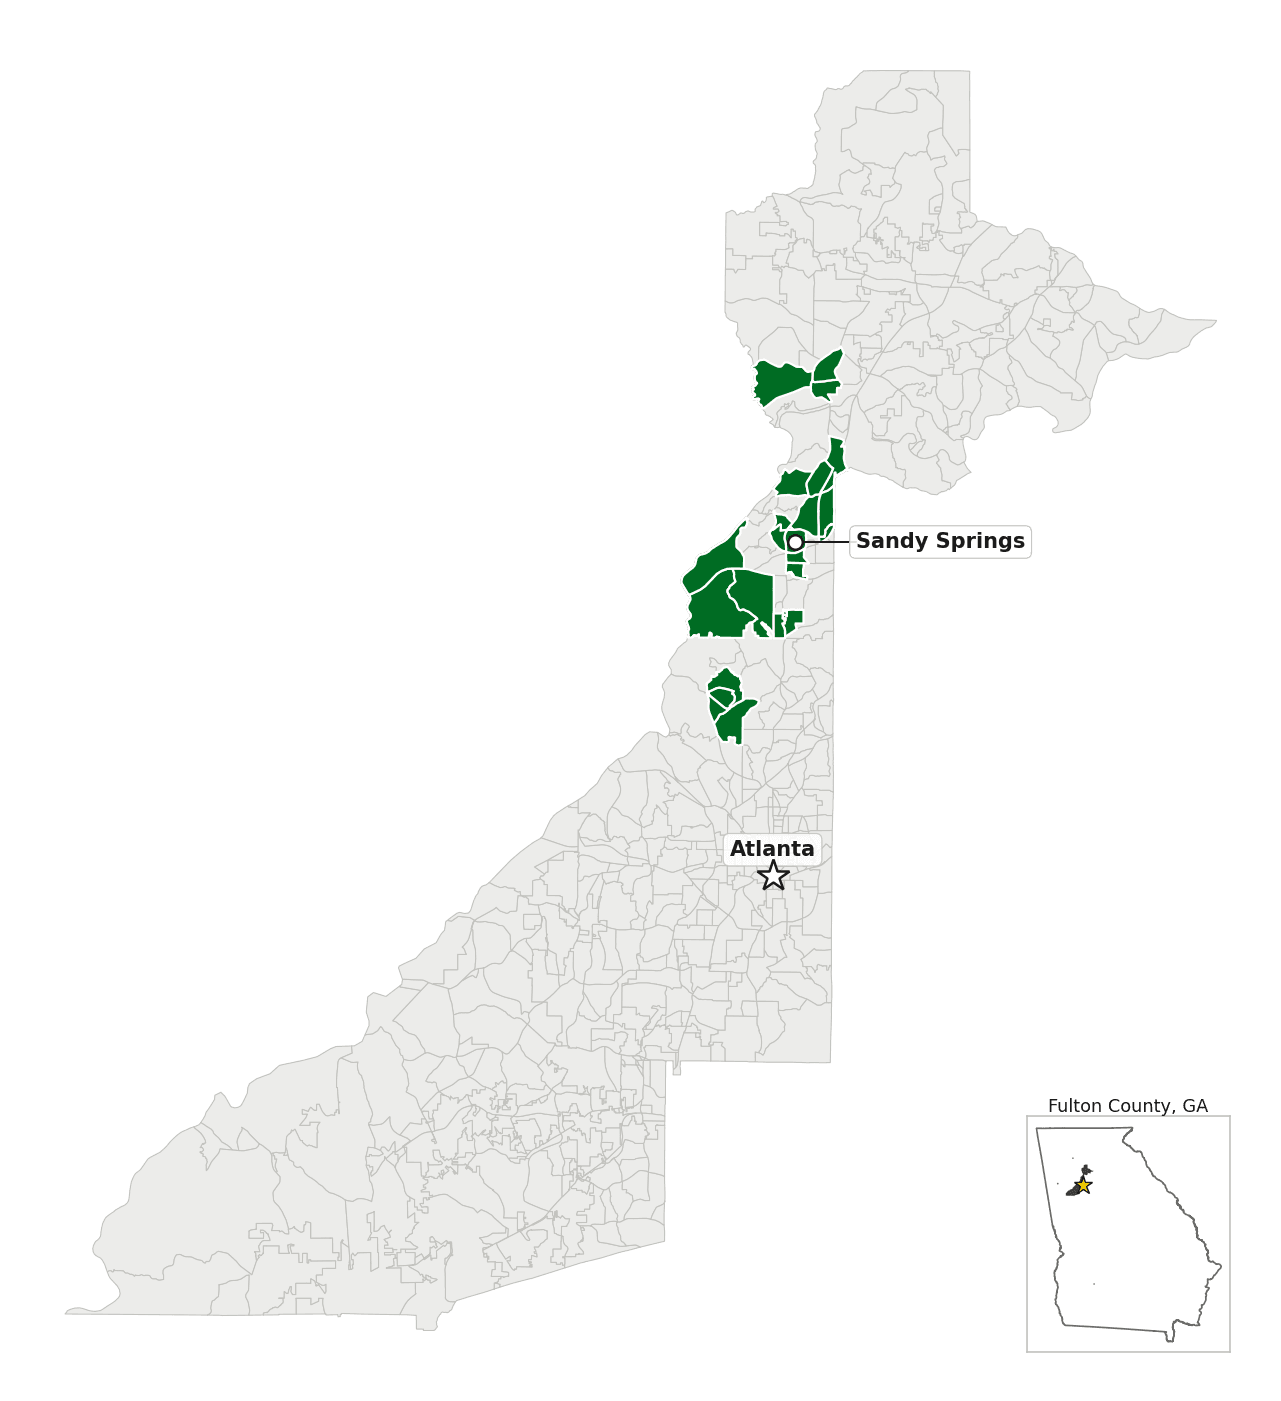
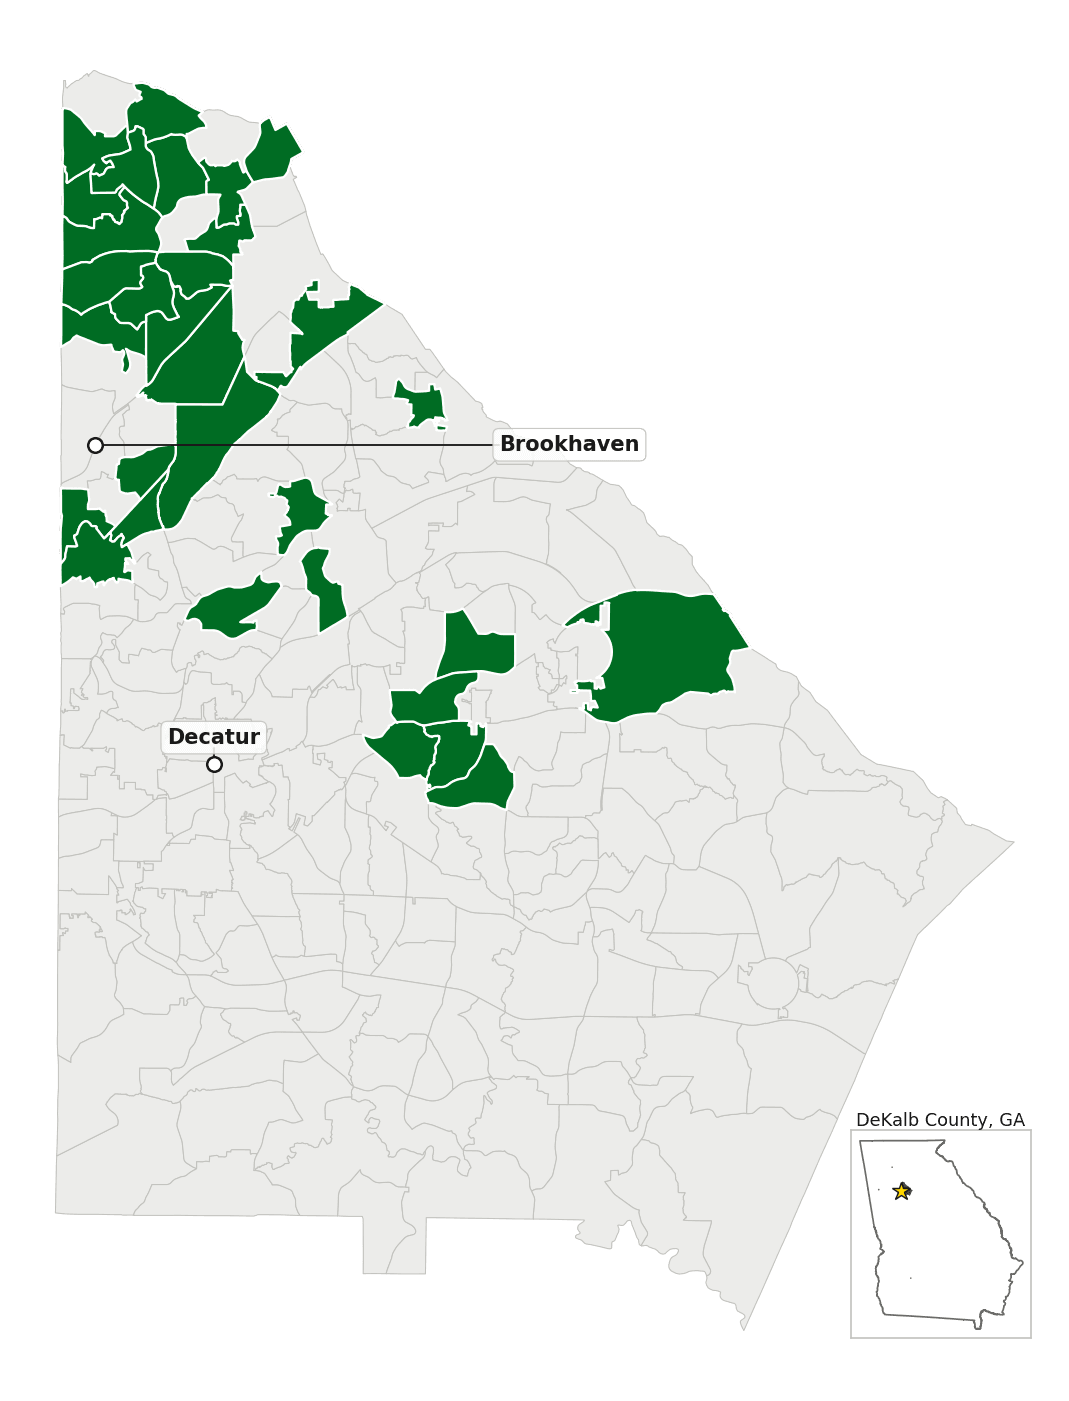
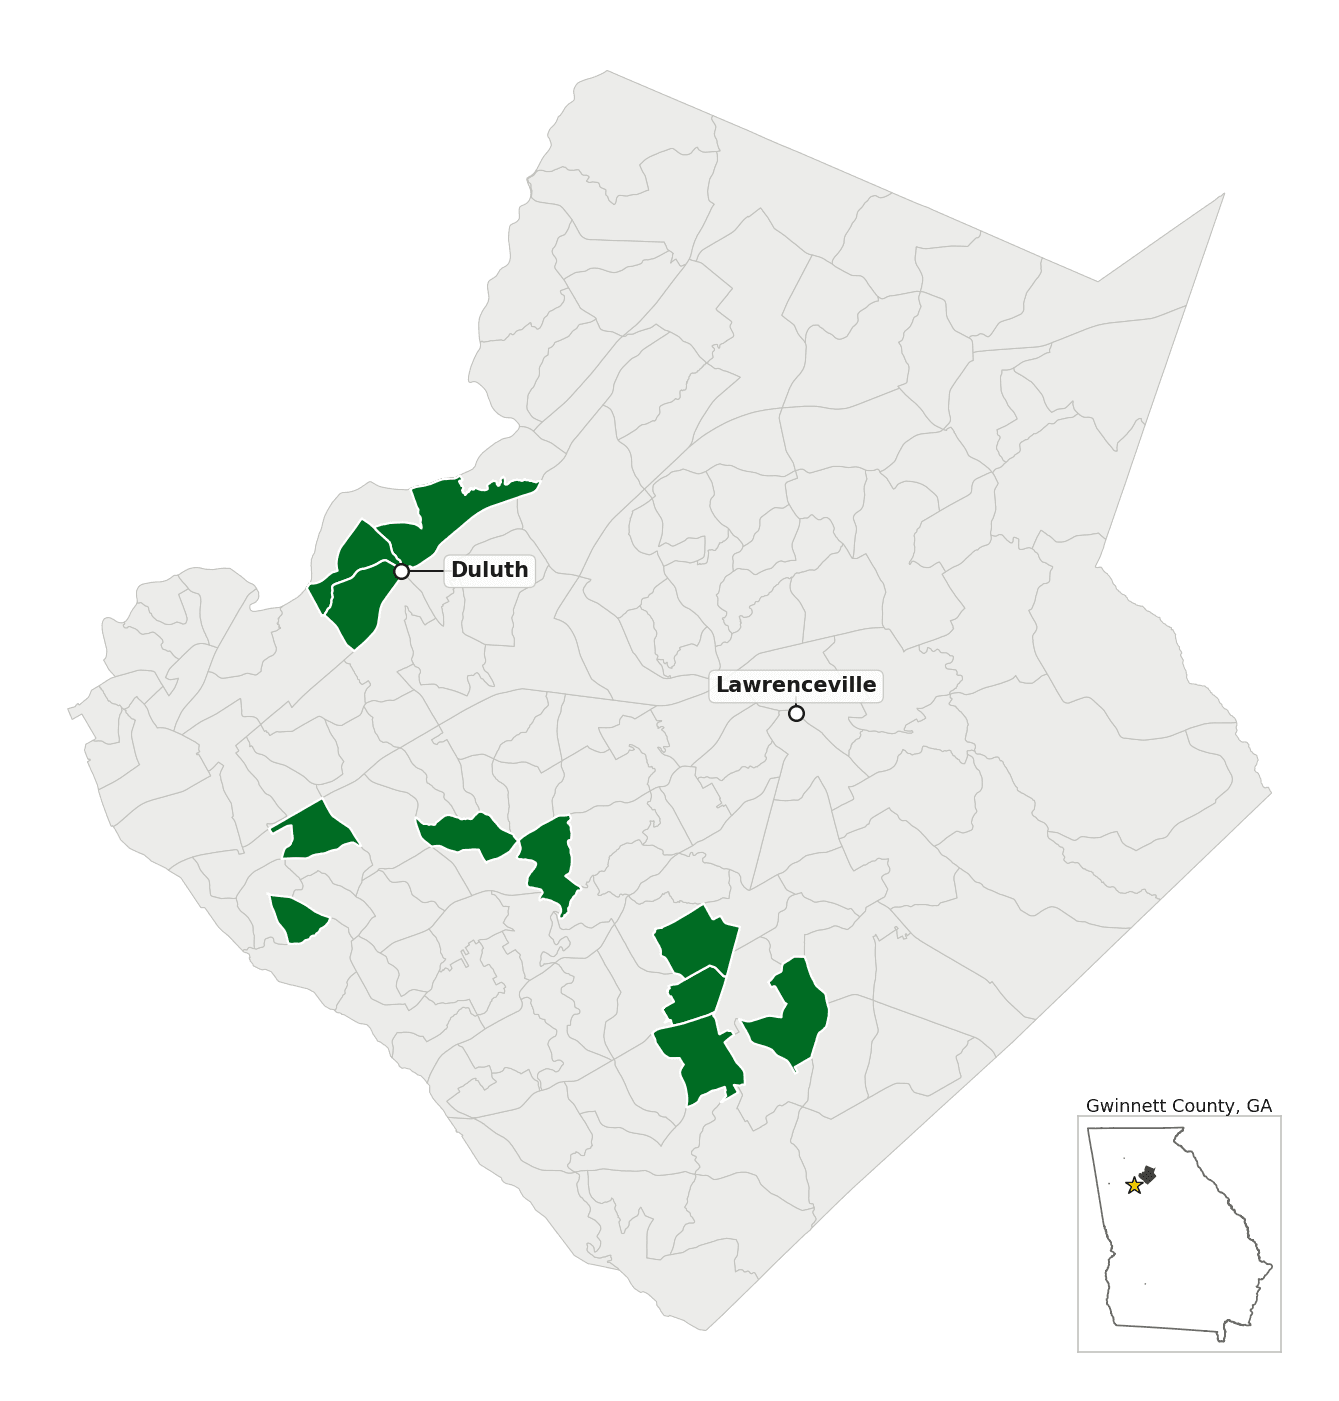
The maps below put the analysis’s central transparency finding on the ground: green precincts were recorded and compared; amber precincts were recorded by our volunteers but have no officially published election-day values to compare against; gray precincts were not recorded.
The discrepancy funnel
Every first-pass mismatch has a documented disposition:
| Disposition | Values | Where | Explanation |
|---|---|---|---|
| Match (plausibly equivalent write-in situation) | 1 | dekalb HF (election day) | Plausibly equivalent write-in situation, Georgia form: the tape shows raw machine counts for every printed line, including the catch-all Write-In and two court-disqualified candidates whose lines Georgia does not certify or publish; the official results credit one resolved write-in to a listed candidate (Harris +1) and drop the rest. The write-in equivalence check passes with the tape internally checksummed, and the Nov 9 election-night export matches the tape exactly - the one-vote difference entered during canvass. |
| Total first-pass mismatches | 1 |
Write-in equivalence check: the DeKalb HF reconciliation
| Tape: qualified candidates (Trump, Harris, Oliver, Stein) | 196 + 359 + 6 + 7 = 568 |
|---|---|
| Tape: non-certifiable lines (Write-In 6, De la Cruz 3, West 2) | 11 |
| Tape: printed Total Votes (internal checksum) | 579 — passes |
| Official: qualified candidates total | 569 (Harris +1 vs tape) |
| Reconciliation | 1 write-in resolved to Harris during canvass; 10 non-certifiable votes dropped; 579 − 10 = 569 — exact |
| Snapshot corroboration | Nov 9 export (Election Night Complete): Harris ED = 359, equal to the tape; Nov 18 post-canvass export: 360. The +1 entered during canvass, consistent with one resolved write-in. |
Transcribed values without an officially published counterpart
Of 1,105 comparison-eligible values transcribed from the tapes, 779 had no officially published election-day value for their precinct and contest — the row exists in the official export with a blank value. By county:
| County | Values Without Published Counterpart |
|---|---|
| Gwinnett | 321 |
| Fulton | 231 |
| Dekalb | 227 |
Submissions by county
| County | Total Submissions Received | Transcribable (election day) |
|---|---|---|
| Dekalb County | 34 | 0 |
| Fulton County | 146 | 0 |
| Gwinnett County | 26 | 0 |
| Montgomery County | 2 | 0 |
Submissions by voting method
| Voting Method | Received | Transcribable |
|---|---|---|
| Advanced Voting | 103 | 0 |
| Election Day | 81 | 66 |
| Unknown | 1 | 0 |
Comparisons by county
| County | Comparisons |
|---|---|
| Dekalb | 276 |
| Fulton | 50 |
Vote coverage
| Jurisdiction | Votes Audited | Official Votes | Share Audited |
|---|---|---|---|
| Fulton | 8,579 | 2,489,484 | 0.34% |
| Dekalb | 67,951 | 2,083,762 | 3.26% |
| Gwinnett | 0 | 1,954,618 | 0.0% |
| All 3 covered counties | 76,530 | 6,527,864 | 1.17% |
| Statewide | 76,530 | 33,553,116 | 0.23% |
Audit power: unaudited votes relative to margins of victory
The decisive comparison for any contest is between its unaudited votes and its margin of victory. None of the 18 audited contests was fully verified or overstatement-protected at this coverage. The presidential race in Georgia (statewide margin 162,188) had 5,497 of its 2,307,297 votes audited. The ten contests where the audit came closest:
| Contest | Jurisdiction | Margin of Victory | Votes Audited | Votes Unaudited |
|---|---|---|---|---|
| STATE HOUSE OF REPRESENTATIVES DISTRICT 86 | Dekalb | 4,428 | 513 | 6,621 |
| STATE HOUSE OF REPRESENTATIVES DISTRICT 83 | Dekalb | 1,998 | 1,021 | 6,865 |
| STATE HOUSE OF REPRESENTATIVES DISTRICT 52 | Dekalb | 2,116 | 778 | 9,148 |
| STATE HOUSE OF REPRESENTATIVES DISTRICT 53 | Fulton | 292 | 70 | 13,924 |
| STATE HOUSE OF REPRESENTATIVES DISTRICT 80 | Dekalb | 2,274 | 1,654 | 14,580 |
| STATE SENATE DISTRICT 41 | Dekalb | 17,640 | 1,290 | 27,676 |
| STATE SENATE DISTRICT 40 | Dekalb | 7,713 | 2,100 | 33,539 |
| COUNTY COMMISSION DISTRICT 2 | Fulton | 3,990 | 590 | 36,096 |
| COUNTY COMMISSIONER D7 SPECIAL | Dekalb | 10,788 | 539 | 56,309 |
| ATLANTA CITY COUNCIL POST 3 AT LARGE SE | Fulton | 9,606 | 41 | 57,523 |
Transcription quality checks
Results tapes print their own per-contest “Total Votes.” Where both it and the full line set were transcribed (88 contest blocks), 68 reproduce the tape’s total exactly from the transcribed values (20 flag transcription gaps such as illegible lines — published in the analysis archive; none affect the comparison, which uses only successfully transcribed values).
Poll tape signature blocks were transcribed for 61 tapes: 60 met the required signature count and 1 showed fewer valid signatures than required. Signature counts are procedural metadata; they do not affect vote totals.
10. Appendix: Video Links
Every transcribable submission used in this analysis is listed below — one row per poll tape. Click a thumbnail or submission ID to open the original video in the public Actual Vote Video Archive.
| Transcribable Submission | Preview | County | Precinct | Voting Method |
|---|---|---|---|---|
| ▶ 4844 | 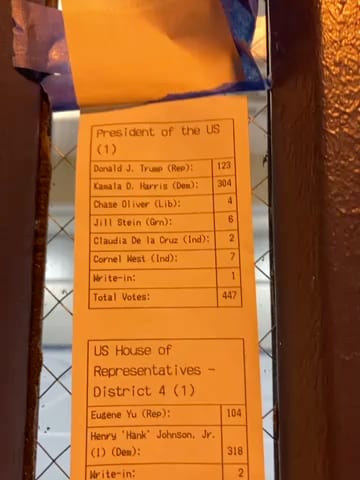 | Dekalb | AA | Election Day |
| ▶ 4789 |  | Dekalb | AH | Election Day |
| ▶ 4854 |  | Dekalb | BD-CW | Election Day |
| ▶ 4826 |  | Dekalb | CE-CZ | Election Day |
 ||
| ▶ 4805 |  | Dekalb | CH | Election Day |
| ▶ 4839 |  | Dekalb | CO-WJ | Election Day |
| ▶ 4845 |  | Dekalb | DC | Election Day |
| ▶ 4846 |  | Dekalb | DE-MN | Election Day |
| ▶ 4812 |  | Dekalb | DF-DI | Election Day |
 ||
| ▶ 4813 |  | Dekalb | DG-TG | Election Day |
| ▶ 4832 |  | Dekalb | GD | Election Day |
| ▶ 4835 |  | Dekalb | HA | Election Day |
| ▶ 4807 |  | Dekalb | HF | Election Day |
| ▶ 4833 |  | Dekalb | KG | Election Day |
| ▶ 4864 | 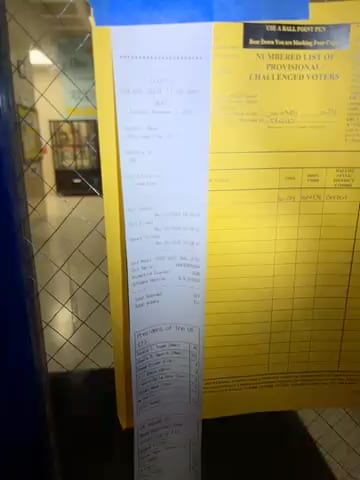 | Dekalb | LV | Election Day |
| ▶ 4804 | 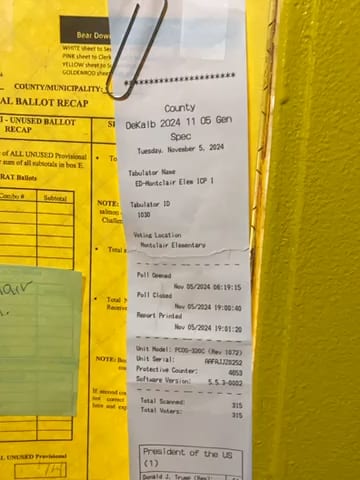 | Dekalb | MJ | Election Day |
| ▶ 4851 |  | Dekalb | MQ | Election Day |
| ▶ 4795 | 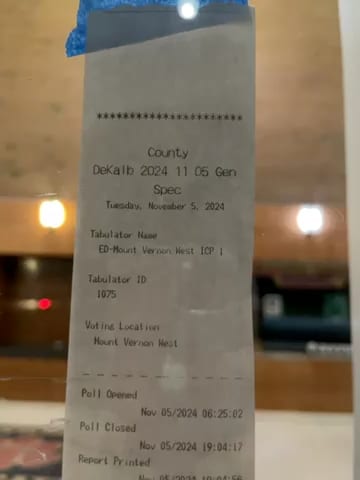 | Dekalb | MS | Election Day |
| ▶ 4791 | 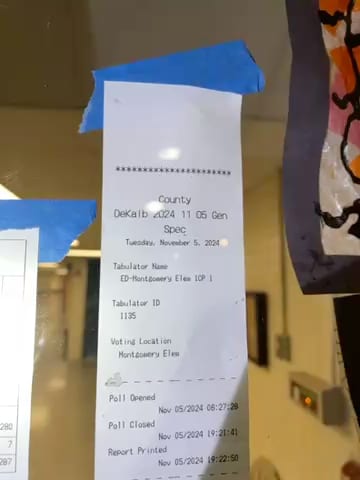 | Dekalb | MU | Election Day |
| ▶ 4824 | 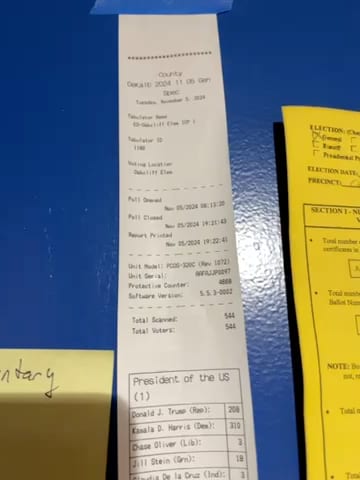 | Dekalb | OB | Election Day |
| ▶ 4868 |  | Dekalb | RD | Election Day |
| ▶ 4849 |  | Dekalb | RJ | Election Day |
| ▶ 4860 |  | Dekalb | SD | Election Day |
| ▶ 4829 | 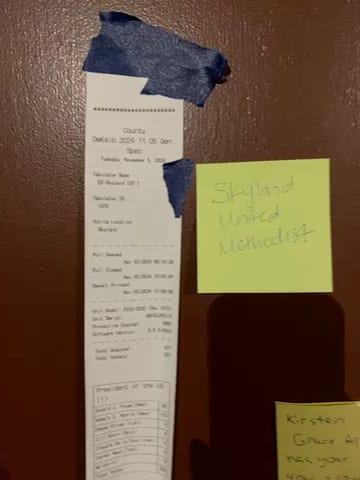 | Dekalb | SF | Election Day |
| ▶ 4810 |  | Dekalb | WL | Election Day |
| ▶ 4775 |  | Fulton | 08D | Election Day |
 ||
| ▶ 4731 |  | Fulton | 08F1-08N1-08N2 | Election Day |
| ▶ 4818 |  | Fulton | RW02-RW03-RW03B | Election Day |
 ||
| Fulton | RW02-RW03-RW03B | Election Day | ||
| ▶ 4748 | 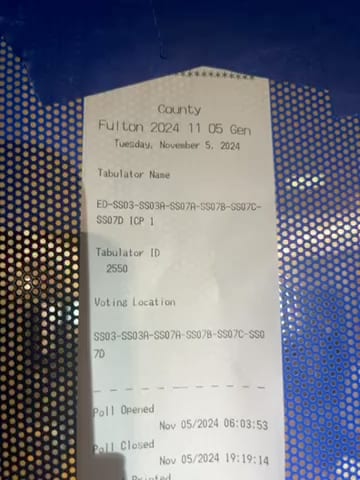 | Fulton | SS03-SS03A-SS07A-SS07B-SS07C-SS07D | Election Day |
 ||
| ▶ 4780 |  | Fulton | SS04-SS04A-SS29A | Election Day |
 ||
| ▶ 4764 | 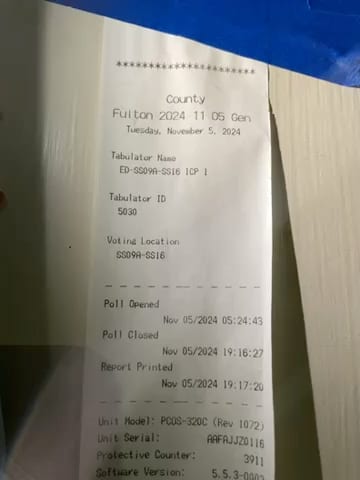 | Fulton | SS09A-SS16 | Election Day |
 ||
| ▶ 4770 | 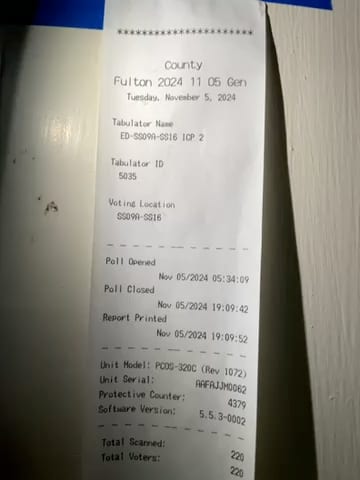 | Fulton | SS09A-SS16 | Election Day |
 ||
| ▶ 4767 |  | Fulton | SS09B-SS13A-SS13B | Election Day |
 ||
| Fulton | SS09B-SS13A-SS13B | Election Day | ||
| ▶ 4761 |  | Fulton | SS19B-SS26 | Election Day |
 ||
| Fulton | SS19B-SS26 | Election Day | ||
| ▶ 4727 | 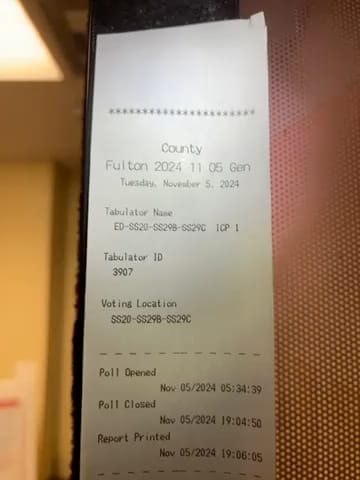 | Fulton | SS20-SS29B-SS29C | Election Day |
| ▶ 4859 | 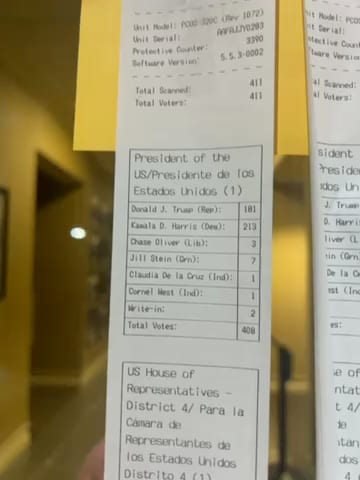 | Gwinnett | 007 | Election Day |
 ||
| ▶ 4875 |  | Gwinnett | 019 | Election Day |
| ▶ 4871 |  | Gwinnett | 023 | Election Day |
| ▶ 4877 |  | Gwinnett | 046 | Election Day |
| ▶ 4876 |  | Gwinnett | 047 | Election Day |
| ▶ 4880 |  | Gwinnett | 053 | Election Day |
 ||
| ▶ 4857 | 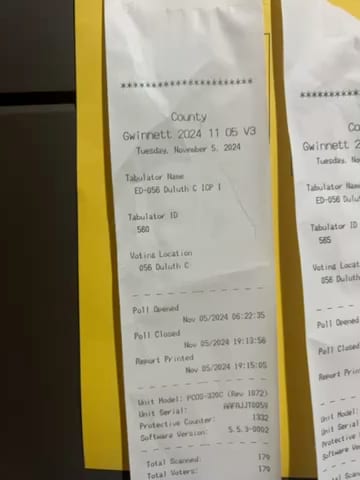 | Gwinnett | 056 | Election Day |
 ||
| ▶ 4878 |  | Gwinnett | 081 | Election Day |
 ||
| ▶ 4865 | 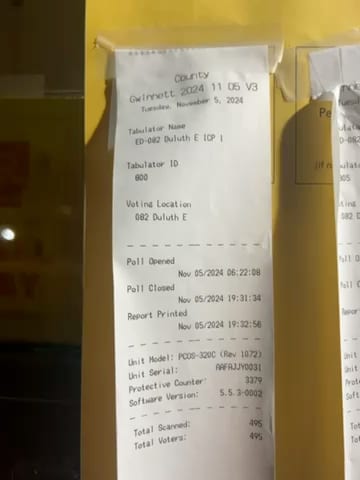 | Gwinnett | 082 | Election Day |
 ||
| ▶ 4863 |  | Gwinnett | 103 | Election Day |
 ||
| ▶ 4873 | 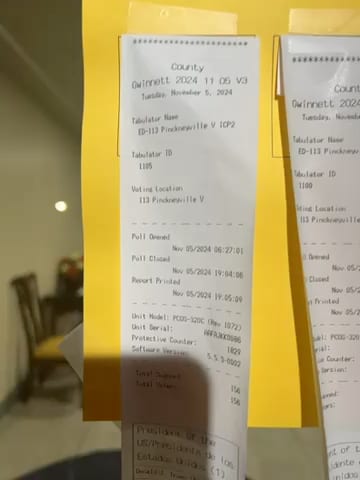 | Gwinnett | 113 | Election Day |
11. Version History
| Version | Date | Change |
|---|---|---|
| v1.0 | 2026-06-05 | First publication. Comparison completed November 18, 2024 (before state certification); numbers frozen from the validated re-run: 326 comparisons, 76,530 votes audited, 0 apparent discrepancies, 1 match (plausibly equivalent write-in situation). Includes precinct coverage maps built from Redistricting Data Hub 2024 General Election boundaries. |